
Advertisement
- United Kingdom
- /
- Capital Markets
- /
- AIM:BPM
B.P. Marsh & Partners PLC's (LON:BPM) CEO Compensation Looks Acceptable To Us And Here's Why
The performance at B.P. Marsh & Partners PLC (LON:BPM) has been rather lacklustre of late and shareholders may be wondering what CEO Alice Hannah Foulk is planning to do about this. They will get a chance to exercise their voting power to influence the future direction of the company in the next AGM on 14 July 2021. Setting appropriate executive remuneration to align with the interests of shareholders may also be a way to influence the company performance in the long run. We have prepared some analysis below to show that CEO compensation looks to be reasonable.
See our latest analysis for B.P. Marsh & Partners
Comparing B.P. Marsh & Partners PLC's CEO Compensation With the industry
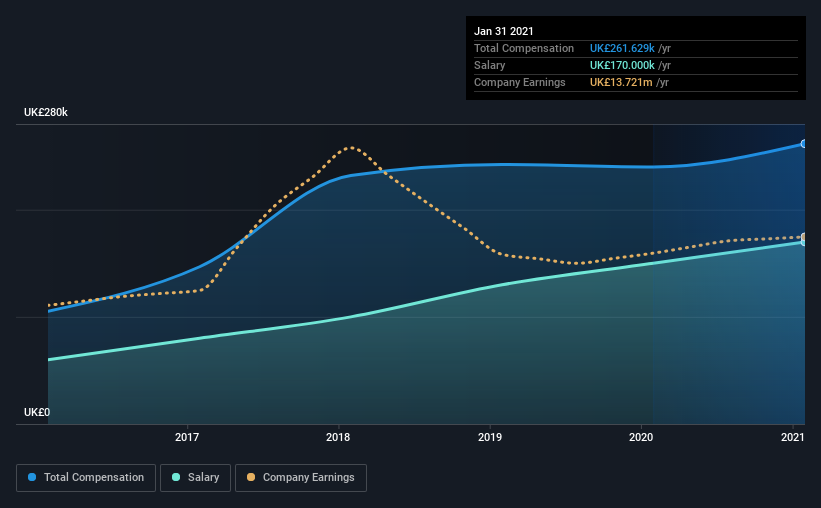
Our data indicates that B.P. Marsh & Partners PLC has a market capitalization of UK£122m, and total annual CEO compensation was reported as UK£262k for the year to January 2021. That's a notable increase of 9.0% on last year. Notably, the salary which is UK£170.0k, represents most of the total compensation being paid.
For comparison, other companies in the same industry with market capitalizations ranging between UK£73m and UK£290m had a median total CEO compensation of UK£465k. In other words, B.P. Marsh & Partners pays its CEO lower than the industry median. Furthermore, Alice Hannah Foulk directly owns UK£700k worth of shares in the company.
| Component | 2021 | 2020 | Proportion (2021) |
| Salary | UK£170k | UK£150k | 65% |
| Other | UK£92k | UK£90k | 35% |
| Total Compensation | UK£262k | UK£240k | 100% |
Talking in terms of the industry, salary represented approximately 47% of total compensation out of all the companies we analyzed, while other remuneration made up 53% of the pie. According to our research, B.P. Marsh & Partners has allocated a higher percentage of pay to salary in comparison to the wider industry. If total compensation veers towards salary, it suggests that the variable portion - which is generally tied to performance, is lower.
A Look at B.P. Marsh & Partners PLC's Growth Numbers
Over the last three years, B.P. Marsh & Partners PLC has shrunk its earnings per share by 18% per year. In the last year, its revenue is up 4.3%.
Overall this is not a very positive result for shareholders. And the modest revenue growth over 12 months isn't much comfort against the reduced EPS. These factors suggest that the business performance wouldn't really justify a high pay packet for the CEO. We don't have analyst forecasts, but you could get a better understanding of its growth by checking out this more detailed historical graph of earnings, revenue and cash flow.
Has B.P. Marsh & Partners PLC Been A Good Investment?
B.P. Marsh & Partners PLC has generated a total shareholder return of 22% over three years, so most shareholders would be reasonably content. But they would probably prefer not to see CEO compensation far in excess of the median.
In Summary...
Shareholder returns while positive, need to be looked at along with earnings, which have failed to grow and this could mean that the current momentum may not continue. Shareholders might want to question the board about these concerns, and revisit their investment thesis for the company.
So you may want to check if insiders are buying B.P. Marsh & Partners shares with their own money (free access).
Of course, you might find a fantastic investment by looking at a different set of stocks. So take a peek at this free list of interesting companies.
When trading B.P. Marsh & Partners or any other investment, use the platform considered by many to be the Professional's Gateway to the Worlds Market, Interactive Brokers. You get the lowest-cost* trading on stocks, options, futures, forex, bonds and funds worldwide from a single integrated account. Promoted
Valuation is complex, but we're here to simplify it.
Discover if B.P. Marsh & Partners might be undervalued or overvalued with our detailed analysis, featuring fair value estimates, potential risks, dividends, insider trades, and its financial condition.
Access Free AnalysisThis article by Simply Wall St is general in nature. It does not constitute a recommendation to buy or sell any stock, and does not take account of your objectives, or your financial situation. We aim to bring you long-term focused analysis driven by fundamental data. Note that our analysis may not factor in the latest price-sensitive company announcements or qualitative material. Simply Wall St has no position in any stocks mentioned.
*Interactive Brokers Rated Lowest Cost Broker by StockBrokers.com Annual Online Review 2020
Have feedback on this article? Concerned about the content? Get in touch with us directly. Alternatively, email editorial-team (at) simplywallst.com.
About AIM:BPM
B.P. Marsh & Partners
Invests in early-stage and SME financial services intermediary businesses in the United Kingdom and internationally.
Flawless balance sheet with solid track record.
Market Insights

Advertisement
Community Narratives
MicroVision will explode future revenue by 380.37% with a vision towards success
Fair Value US$60|98.4% undervalued
TH
Community Contributor
The Indispensable Artery for a New North American Economy
Fair Value CA$132.87|1.6% undervalued
TI
Community Contributor
Recently Updated Narratives
BE


Bejgal on MINISO Group Holding ·
MINISO's fair value is projected at 26.69 with an anticipated PE ratio shift of 20x
Fair Value:US$26.6928.0% undervalued
44 followersusers have followed this narrative
3 commentsusers have commented on this narrative
0 likesusers have liked this narrative
TI


TickerTickle on Oracle ·
The Quiet Giant That Became AI’s Power Grid
Fair Value:US$389.8149.5% undervalued
7 followersusers have followed this narrative
1 commentusers have commented on this narrative
0 likesusers have liked this narrative
AU

AuCA on Nova Ljubljanska Banka d.d ·
Nova Ljubljanska Banka d.d will expect a 11.2% revenue boost driving future growth
Fair Value:€20916.3% undervalued
23 followersusers have followed this narrative
3 commentsusers have commented on this narrative
0 likesusers have liked this narrative
Popular Narratives
OS


oscargarcia on Alphabet ·
The company that turned a verb into a global necessity and basically runs the modern internet, digital ads, smartphones, maps, and AI.
Fair Value:US$3404.9% undervalued
134 followersusers have followed this narrative
6 commentsusers have commented on this narrative
18 likesusers have liked this narrative
TH

TheWallstreetKing on MicroVision ·
MicroVision will explode future revenue by 380.37% with a vision towards success
Fair Value:US$6098.4% undervalued
83 followersusers have followed this narrative
11 commentsusers have commented on this narrative
18 likesusers have liked this narrative
AN


AnalystConsensusTarget on NVIDIA ·
NVDA: Expanding AI Demand Will Drive Major Data Center Investments Through 2026
Fair Value:US$232.7923.6% undervalued
923 followersusers have followed this narrative
5 commentsusers have commented on this narrative
22 likesusers have liked this narrative