
Advertisement
- United Kingdom
- /
- Capital Markets
- /
- AIM:APQ
Market Cool On APQ Global Limited's (LON:APQ) Revenues Pushing Shares 66% Lower
APQ Global Limited (LON:APQ) shares have had a horrible month, losing 66% after a relatively good period beforehand. The drop over the last 30 days has capped off a tough year for shareholders, with the share price down 27% in that time.
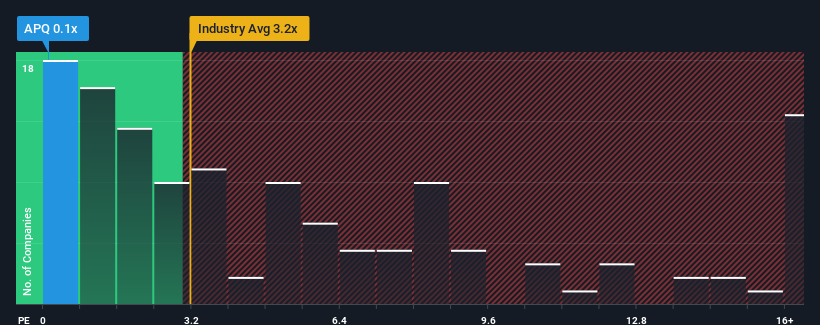
Since its price has dipped substantially, APQ Global's price-to-sales (or "P/S") ratio of 0.1x might make it look like a strong buy right now compared to the wider Capital Markets industry in the United Kingdom, where around half of the companies have P/S ratios above 3.2x and even P/S above 9x are quite common. Nonetheless, we'd need to dig a little deeper to determine if there is a rational basis for the highly reduced P/S.
View our latest analysis for APQ Global
How Has APQ Global Performed Recently?
APQ Global certainly has been doing a great job lately as it's been growing its revenue at a really rapid pace. It might be that many expect the strong revenue performance to degrade substantially, which has repressed the P/S ratio. If that doesn't eventuate, then existing shareholders have reason to be quite optimistic about the future direction of the share price.
We don't have analyst forecasts, but you can see how recent trends are setting up the company for the future by checking out our free report on APQ Global's earnings, revenue and cash flow.Do Revenue Forecasts Match The Low P/S Ratio?
There's an inherent assumption that a company should far underperform the industry for P/S ratios like APQ Global's to be considered reasonable.
Retrospectively, the last year delivered an explosive gain to the company's top line. The amazing performance means it was also able to grow revenue by 84% in total over the last three years. So we can start by confirming that the company has done a great job of growing revenue over that time.
Comparing that recent medium-term revenue trajectory with the industry's one-year growth forecast of 19% shows it's noticeably more attractive.
With this in mind, we find it intriguing that APQ Global's P/S isn't as high compared to that of its industry peers. It looks like most investors are not convinced the company can maintain its recent growth rates.
The Final Word
APQ Global's P/S looks about as weak as its stock price lately. Generally, our preference is to limit the use of the price-to-sales ratio to establishing what the market thinks about the overall health of a company.
We're very surprised to see APQ Global currently trading on a much lower than expected P/S since its recent three-year growth is higher than the wider industry forecast. When we see robust revenue growth that outpaces the industry, we presume that there are notable underlying risks to the company's future performance, which is exerting downward pressure on the P/S ratio. At least price risks look to be very low if recent medium-term revenue trends continue, but investors seem to think future revenue could see a lot of volatility.
Before you settle on your opinion, we've discovered 3 warning signs for APQ Global that you should be aware of.
If you're unsure about the strength of APQ Global's business, why not explore our interactive list of stocks with solid business fundamentals for some other companies you may have missed.
New: Manage All Your Stock Portfolios in One Place
We've created the ultimate portfolio companion for stock investors, and it's free.
• Connect an unlimited number of Portfolios and see your total in one currency
• Be alerted to new Warning Signs or Risks via email or mobile
• Track the Fair Value of your stocks
Have feedback on this article? Concerned about the content? Get in touch with us directly. Alternatively, email editorial-team (at) simplywallst.com.
This article by Simply Wall St is general in nature. We provide commentary based on historical data and analyst forecasts only using an unbiased methodology and our articles are not intended to be financial advice. It does not constitute a recommendation to buy or sell any stock, and does not take account of your objectives, or your financial situation. We aim to bring you long-term focused analysis driven by fundamental data. Note that our analysis may not factor in the latest price-sensitive company announcements or qualitative material. Simply Wall St has no position in any stocks mentioned.
About AIM:APQ
APQ Global
Engages in the investment bsuiness in Asia, Latin America, Eastern Europe, the Middle East, Africa, and the Channel Islands.
Acceptable track record low.
Market Insights

Advertisement
Community Narratives
Finding The True Value Of A Logistics Powerhouse
Fair Value US$95.21|8.4% undervalued
NV
Community Contributor
Paradigm Biopharmaceuticals Will Lead Osteoarthritis Treatment with Zilosul's FDA Success
Fair Value AU$5.50|92.1% undervalued
AM
Community Contributor
Barrick Mining (ABX:CA): A Gold Hedge against a U.S. Shutdown
Fair Value CA$60.00|24.2% undervalued
GM
Community Contributor