
Advertisement
Legendary fund manager Li Lu (who Charlie Munger backed) once said, 'The biggest investment risk is not the volatility of prices, but whether you will suffer a permanent loss of capital.' When we think about how risky a company is, we always like to look at its use of debt, since debt overload can lead to ruin. As with many other companies Pearson plc (LON:PSON) makes use of debt. But should shareholders be worried about its use of debt?
What Risk Does Debt Bring?
Debt and other liabilities become risky for a business when it cannot easily fulfill those obligations, either with free cash flow or by raising capital at an attractive price. Part and parcel of capitalism is the process of 'creative destruction' where failed businesses are mercilessly liquidated by their bankers. However, a more usual (but still expensive) situation is where a company must dilute shareholders at a cheap share price simply to get debt under control. Having said that, the most common situation is where a company manages its debt reasonably well - and to its own advantage. The first thing to do when considering how much debt a business uses is to look at its cash and debt together.
What Is Pearson's Net Debt?
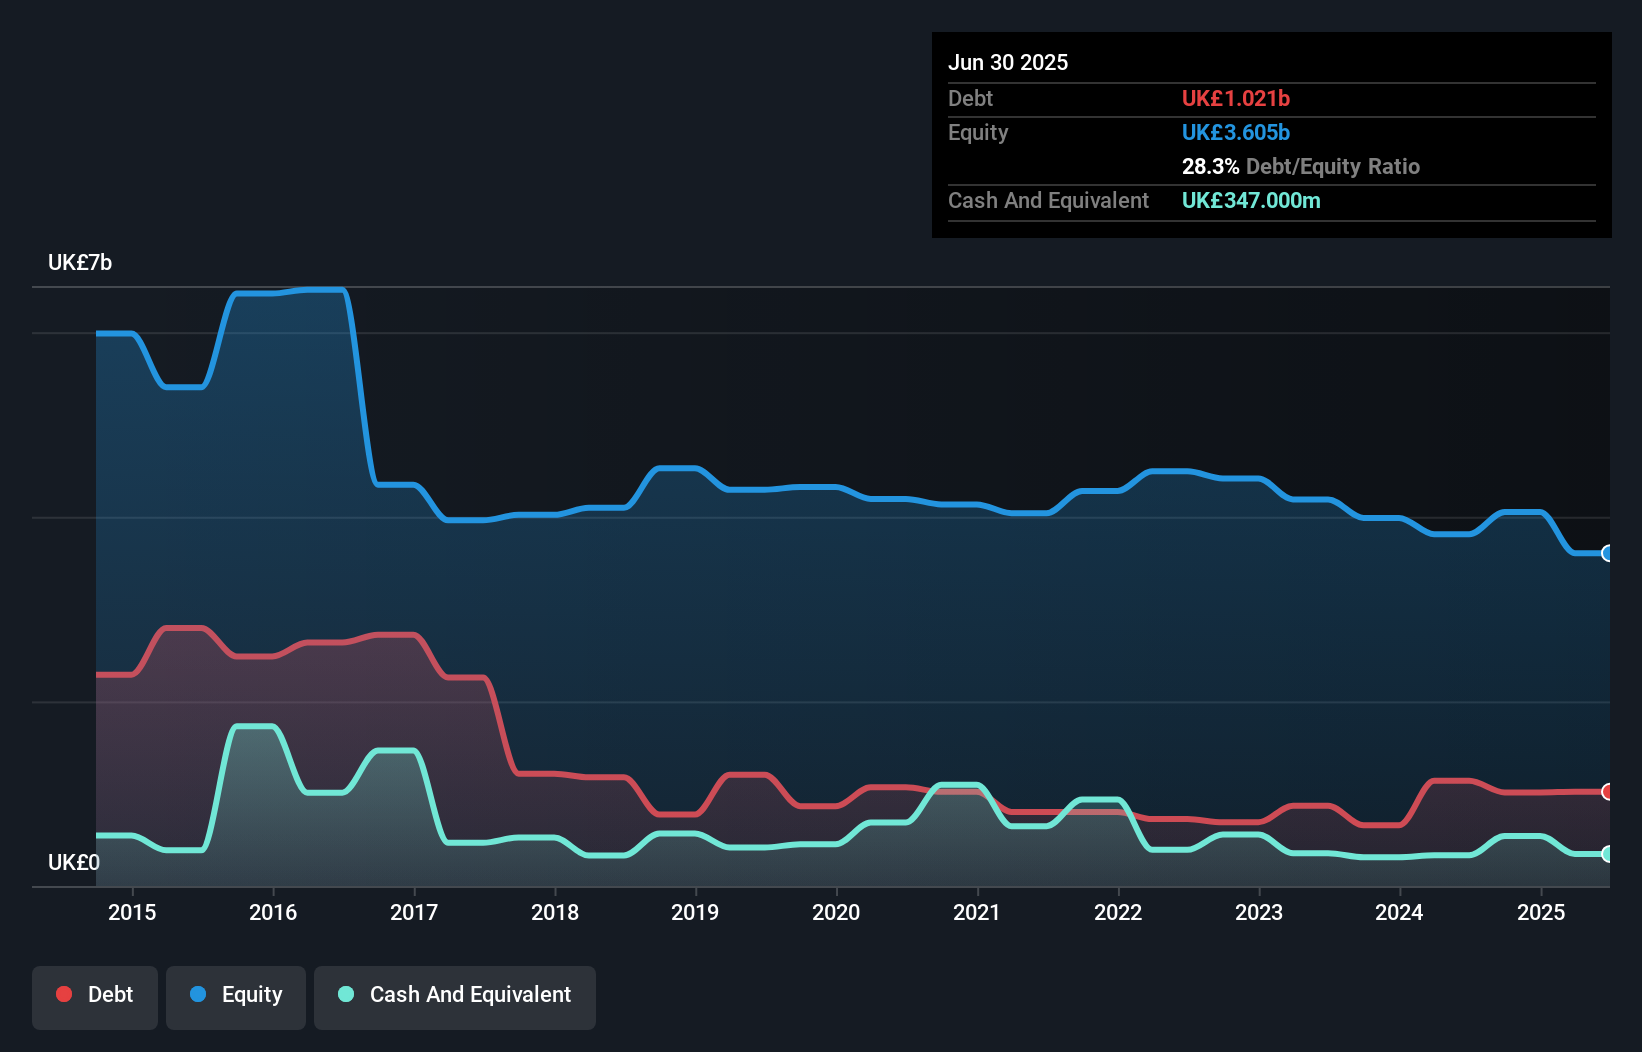
The image below, which you can click on for greater detail, shows that Pearson had debt of UK£1.02b at the end of June 2025, a reduction from UK£1.14b over a year. On the flip side, it has UK£347.0m in cash leading to net debt of about UK£674.0m.
A Look At Pearson's Liabilities
The latest balance sheet data shows that Pearson had liabilities of UK£1.01b due within a year, and liabilities of UK£1.61b falling due after that. On the other hand, it had cash of UK£347.0m and UK£1.01b worth of receivables due within a year. So its liabilities outweigh the sum of its cash and (near-term) receivables by UK£1.26b.
Of course, Pearson has a market capitalization of UK£7.39b, so these liabilities are probably manageable. Having said that, it's clear that we should continue to monitor its balance sheet, lest it change for the worse.
View our latest analysis for Pearson
We use two main ratios to inform us about debt levels relative to earnings. The first is net debt divided by earnings before interest, tax, depreciation, and amortization (EBITDA), while the second is how many times its earnings before interest and tax (EBIT) covers its interest expense (or its interest cover, for short). This way, we consider both the absolute quantum of the debt, as well as the interest rates paid on it.
Pearson's net debt is only 1.0 times its EBITDA. And its EBIT covers its interest expense a whopping 12.2 times over. So you could argue it is no more threatened by its debt than an elephant is by a mouse. The good news is that Pearson has increased its EBIT by 9.1% over twelve months, which should ease any concerns about debt repayment. There's no doubt that we learn most about debt from the balance sheet. But it is future earnings, more than anything, that will determine Pearson's ability to maintain a healthy balance sheet going forward. So if you want to see what the professionals think, you might find this free report on analyst profit forecasts to be interesting.
Finally, a business needs free cash flow to pay off debt; accounting profits just don't cut it. So we always check how much of that EBIT is translated into free cash flow. Over the last three years, Pearson recorded free cash flow worth a fulsome 82% of its EBIT, which is stronger than we'd usually expect. That puts it in a very strong position to pay down debt.
Our View
The good news is that Pearson's demonstrated ability to cover its interest expense with its EBIT delights us like a fluffy puppy does a toddler. And that's just the beginning of the good news since its conversion of EBIT to free cash flow is also very heartening. Looking at the bigger picture, we think Pearson's use of debt seems quite reasonable and we're not concerned about it. After all, sensible leverage can boost returns on equity. Above most other metrics, we think its important to track how fast earnings per share is growing, if at all. If you've also come to that realization, you're in luck, because today you can view this interactive graph of Pearson's earnings per share history for free.
Of course, if you're the type of investor who prefers buying stocks without the burden of debt, then don't hesitate to discover our exclusive list of net cash growth stocks, today.
New: Manage All Your Stock Portfolios in One Place
We've created the ultimate portfolio companion for stock investors, and it's free.
• Connect an unlimited number of Portfolios and see your total in one currency
• Be alerted to new Warning Signs or Risks via email or mobile
• Track the Fair Value of your stocks
Have feedback on this article? Concerned about the content? Get in touch with us directly. Alternatively, email editorial-team (at) simplywallst.com.
This article by Simply Wall St is general in nature. We provide commentary based on historical data and analyst forecasts only using an unbiased methodology and our articles are not intended to be financial advice. It does not constitute a recommendation to buy or sell any stock, and does not take account of your objectives, or your financial situation. We aim to bring you long-term focused analysis driven by fundamental data. Note that our analysis may not factor in the latest price-sensitive company announcements or qualitative material. Simply Wall St has no position in any stocks mentioned.
About LSE:PSON
Pearson
Provides educational courseware, assessments, and services in the United Kingdom, the United States, Canada, the Asia Pacific, other European countries, and internationally.
Very undervalued with excellent balance sheet.
Similar Companies
Market Insights

Advertisement
Community Narratives
MINISO's fair value is projected at 26.69 with an anticipated PE ratio shift of 20x
Fair Value US$24.03|11.4% undervalued
BE
Community Contributor
Procter & Gamble: A Dividend Giant Facing Slowing Growth
Fair Value US$119.81|23.5% overvalued
AN
Community Contributor
Eli Lilly's Future Growth Driven by Tirzepatide and Favorable Market Conditions
Fair Value US$1.19k|14.0% undervalued
EA
Community Contributor