
Advertisement
- United Kingdom
- /
- Hospitality
- /
- AIM:NXQ
There May Be Reason For Hope In Nexteq's (LON:NXQ) Disappointing Earnings
Shareholders appeared unconcerned with Nexteq plc's (LON:NXQ) lackluster earnings report last week. We think that the softer headline numbers might be getting counterbalanced by some positive underlying factors.
Check out our latest analysis for Nexteq
Zooming In On Nexteq's Earnings
One key financial ratio used to measure how well a company converts its profit to free cash flow (FCF) is the accrual ratio. The accrual ratio subtracts the FCF from the profit for a given period, and divides the result by the average operating assets of the company over that time. The ratio shows us how much a company's profit exceeds its FCF.
That means a negative accrual ratio is a good thing, because it shows that the company is bringing in more free cash flow than its profit would suggest. While having an accrual ratio above zero is of little concern, we do think it's worth noting when a company has a relatively high accrual ratio. Notably, there is some academic evidence that suggests that a high accrual ratio is a bad sign for near-term profits, generally speaking.
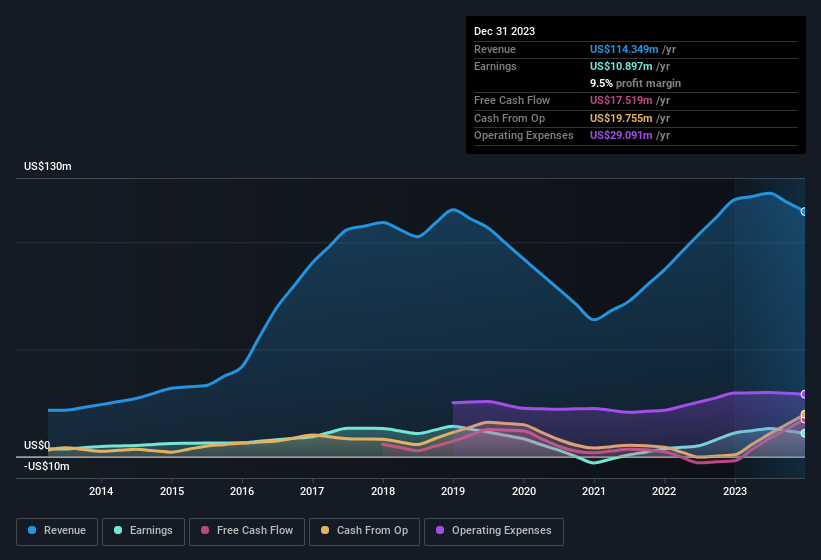
For the year to December 2023, Nexteq had an accrual ratio of -0.12. That indicates that its free cash flow was a fair bit more than its statutory profit. In fact, it had free cash flow of US$18m in the last year, which was a lot more than its statutory profit of US$10.9m. Notably, Nexteq had negative free cash flow last year, so the US$18m it produced this year was a welcome improvement.
That might leave you wondering what analysts are forecasting in terms of future profitability. Luckily, you can click here to see an interactive graph depicting future profitability, based on their estimates.
Our Take On Nexteq's Profit Performance
As we discussed above, Nexteq has perfectly satisfactory free cash flow relative to profit. Because of this, we think Nexteq's earnings potential is at least as good as it seems, and maybe even better! Unfortunately, though, its earnings per share actually fell back over the last year. At the end of the day, it's essential to consider more than just the factors above, if you want to understand the company properly. Obviously, we love to consider the historical data to inform our opinion of a company. But it can be really valuable to consider what other analysts are forecasting. So feel free to check out our free graph representing analyst forecasts.
Today we've zoomed in on a single data point to better understand the nature of Nexteq's profit. But there are plenty of other ways to inform your opinion of a company. Some people consider a high return on equity to be a good sign of a quality business. So you may wish to see this free collection of companies boasting high return on equity, or this list of stocks that insiders are buying.
Valuation is complex, but we're here to simplify it.
Discover if Nexteq might be undervalued or overvalued with our detailed analysis, featuring fair value estimates, potential risks, dividends, insider trades, and its financial condition.
Access Free AnalysisHave feedback on this article? Concerned about the content? Get in touch with us directly. Alternatively, email editorial-team (at) simplywallst.com.
This article by Simply Wall St is general in nature. We provide commentary based on historical data and analyst forecasts only using an unbiased methodology and our articles are not intended to be financial advice. It does not constitute a recommendation to buy or sell any stock, and does not take account of your objectives, or your financial situation. We aim to bring you long-term focused analysis driven by fundamental data. Note that our analysis may not factor in the latest price-sensitive company announcements or qualitative material. Simply Wall St has no position in any stocks mentioned.
About AIM:NXQ
Nexteq
Operates as a technology solution provider to customers in industrial markets in North America, Asia, Australia, the United Kingdom, rest of Europe, and internationally.
Excellent balance sheet with reasonable growth potential.
Market Insights

Advertisement
Community Narratives
MicroVision will explode future revenue by 380.37% with a vision towards success
Fair Value US$60|98.4% undervalued
TH
Community Contributor
The Indispensable Artery for a New North American Economy
Fair Value CA$132.87|0.8% undervalued
TI
Community Contributor
Recently Updated Narratives
CO

composite32 on TAV Havalimanlari Holding ·
TAV Havalimanlari Holding will fly high with 25.68% revenue growth
Fair Value:₺545.1648.6% undervalued
1 followerusers have followed this narrative
0 commentsusers have commented on this narrative
0 likesusers have liked this narrative
RO


Robbo on Fiducian Group ·
Fiducian: Compliance Clouds or Value Opportunity?
Fair Value:AU$122.3% overvalued
1 followerusers have followed this narrative
0 commentsusers have commented on this narrative
0 likesusers have liked this narrative
MA


MarkoVT on COVER ·
Q3 Outlook modestly optimistic
Fair Value:JP¥1.65k2.0% overvalued
1 followerusers have followed this narrative
0 commentsusers have commented on this narrative
0 likesusers have liked this narrative
Popular Narratives
OS


oscargarcia on Alphabet ·
The company that turned a verb into a global necessity and basically runs the modern internet, digital ads, smartphones, maps, and AI.
Fair Value:US$3405.9% undervalued
136 followersusers have followed this narrative
6 commentsusers have commented on this narrative
18 likesusers have liked this narrative
TH

TheWallstreetKing on MicroVision ·
MicroVision will explode future revenue by 380.37% with a vision towards success
Fair Value:US$6098.4% undervalued
92 followersusers have followed this narrative
10 commentsusers have commented on this narrative
18 likesusers have liked this narrative
AN


AnalystConsensusTarget on NVIDIA ·
NVDA: Expanding AI Demand Will Drive Major Data Center Investments Through 2026
Fair Value:US$232.7922.6% undervalued
927 followersusers have followed this narrative
6 commentsusers have commented on this narrative
22 likesusers have liked this narrative