- United Kingdom
- /
- Food and Staples Retail
- /
- LSE:SBRY
Is J Sainsbury plc's (LON:SBRY) Recent Stock Performance Influenced By Its Financials In Any Way?


J Sainsbury's (LON:SBRY) stock is up by 4.7% over the past month. Given that stock prices are usually aligned with a company's financial performance in the long-term, we decided to investigate if the company's decent financials had a hand to play in the recent price move. Particularly, we will be paying attention to J Sainsbury's ROE today.
Return on equity or ROE is a key measure used to assess how efficiently a company's management is utilizing the company's capital. Simply put, it is used to assess the profitability of a company in relation to its equity capital.
See our latest analysis for J Sainsbury
How Do You Calculate Return On Equity?
The formula for return on equity is:
Return on Equity = Net Profit (from continuing operations) ÷ Shareholders' Equity
So, based on the above formula, the ROE for J Sainsbury is:
2.0% = UK£137m ÷ UK£6.9b (Based on the trailing twelve months to March 2024).
The 'return' is the amount earned after tax over the last twelve months. That means that for every £1 worth of shareholders' equity, the company generated £0.02 in profit.
What Has ROE Got To Do With Earnings Growth?
So far, we've learned that ROE is a measure of a company's profitability. Depending on how much of these profits the company reinvests or "retains", and how effectively it does so, we are then able to assess a company’s earnings growth potential. Assuming all else is equal, companies that have both a higher return on equity and higher profit retention are usually the ones that have a higher growth rate when compared to companies that don't have the same features.
J Sainsbury's Earnings Growth And 2.0% ROE
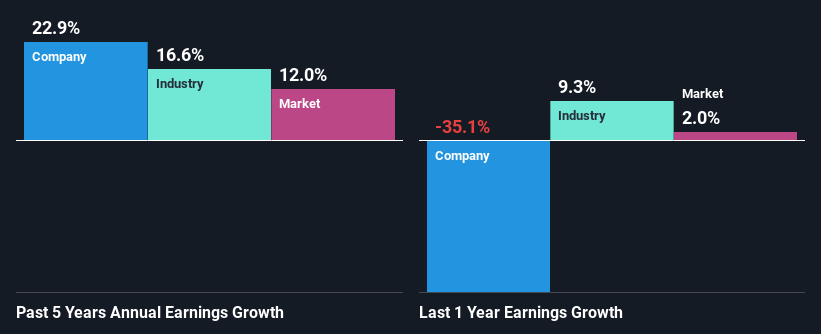
It is hard to argue that J Sainsbury's ROE is much good in and of itself. Even compared to the average industry ROE of 15%, the company's ROE is quite dismal. However, we we're pleasantly surprised to see that J Sainsbury grew its net income at a significant rate of 23% in the last five years. Therefore, there could be other reasons behind this growth. Such as - high earnings retention or an efficient management in place.
As a next step, we compared J Sainsbury's net income growth with the industry, and pleasingly, we found that the growth seen by the company is higher than the average industry growth of 17%.
Earnings growth is a huge factor in stock valuation. It’s important for an investor to know whether the market has priced in the company's expected earnings growth (or decline). By doing so, they will have an idea if the stock is headed into clear blue waters or if swampy waters await. If you're wondering about J Sainsbury's's valuation, check out this gauge of its price-to-earnings ratio, as compared to its industry.
Is J Sainsbury Using Its Retained Earnings Effectively?
J Sainsbury's significant three-year median payout ratio of 79% (where it is retaining only 21% of its income) suggests that the company has been able to achieve a high growth in earnings despite returning most of its income to shareholders.
Besides, J Sainsbury has been paying dividends for at least ten years or more. This shows that the company is committed to sharing profits with its shareholders. Our latest analyst data shows that the future payout ratio of the company is expected to drop to 57% over the next three years. As a result, the expected drop in J Sainsbury's payout ratio explains the anticipated rise in the company's future ROE to 8.0%, over the same period.
Conclusion
Overall, we feel that J Sainsbury certainly does have some positive factors to consider. While no doubt its earnings growth is pretty substantial, we do feel that the reinvestment rate is pretty low, meaning, the earnings growth number could have been significantly higher had the company been retaining more of its profits. On studying current analyst estimates, we found that analysts expect the company to continue its recent growth streak. To know more about the company's future earnings growth forecasts take a look at this free report on analyst forecasts for the company to find out more.
New: Manage All Your Stock Portfolios in One Place
We've created the ultimate portfolio companion for stock investors, and it's free.
• Connect an unlimited number of Portfolios and see your total in one currency
• Be alerted to new Warning Signs or Risks via email or mobile
• Track the Fair Value of your stocks
Have feedback on this article? Concerned about the content? Get in touch with us directly. Alternatively, email editorial-team (at) simplywallst.com.
This article by Simply Wall St is general in nature. We provide commentary based on historical data and analyst forecasts only using an unbiased methodology and our articles are not intended to be financial advice. It does not constitute a recommendation to buy or sell any stock, and does not take account of your objectives, or your financial situation. We aim to bring you long-term focused analysis driven by fundamental data. Note that our analysis may not factor in the latest price-sensitive company announcements or qualitative material. Simply Wall St has no position in any stocks mentioned.
About LSE:SBRY
J Sainsbury
Engages in the food, general merchandise and clothing retailing, and financial services activities in the United Kingdom and the Republic of Ireland.
Excellent balance sheet with proven track record.
