
Advertisement
- United Kingdom
- /
- Consumer Durables
- /
- LSE:BKG
A Look At The Intrinsic Value Of The Berkeley Group Holdings plc (LON:BKG)
Key Insights
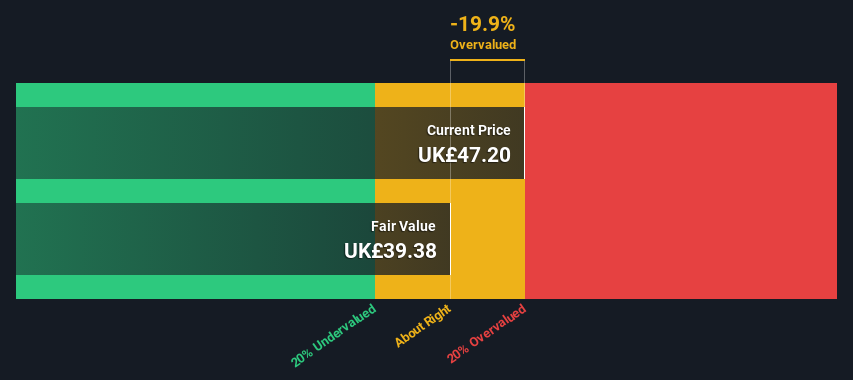
- Berkeley Group Holdings' estimated fair value is UK£39.38 based on 2 Stage Free Cash Flow to Equity
- Current share price of UK£47.20 suggests Berkeley Group Holdings is potentially trading close to its fair value
- Our fair value estimate is 24% lower than Berkeley Group Holdings' analyst price target of UK£52.02
Does the October share price for The Berkeley Group Holdings plc (LON:BKG) reflect what it's really worth? Today, we will estimate the stock's intrinsic value by taking the expected future cash flows and discounting them to their present value. One way to achieve this is by employing the Discounted Cash Flow (DCF) model. Models like these may appear beyond the comprehension of a lay person, but they're fairly easy to follow.
We would caution that there are many ways of valuing a company and, like the DCF, each technique has advantages and disadvantages in certain scenarios. Anyone interested in learning a bit more about intrinsic value should have a read of the Simply Wall St analysis model.
Check out our latest analysis for Berkeley Group Holdings
The Calculation
We're using the 2-stage growth model, which simply means we take in account two stages of company's growth. In the initial period the company may have a higher growth rate and the second stage is usually assumed to have a stable growth rate. To begin with, we have to get estimates of the next ten years of cash flows. Where possible we use analyst estimates, but when these aren't available we extrapolate the previous free cash flow (FCF) from the last estimate or reported value. We assume companies with shrinking free cash flow will slow their rate of shrinkage, and that companies with growing free cash flow will see their growth rate slow, over this period. We do this to reflect that growth tends to slow more in the early years than it does in later years.
A DCF is all about the idea that a dollar in the future is less valuable than a dollar today, and so the sum of these future cash flows is then discounted to today's value:
10-year free cash flow (FCF) estimate
| 2025 | 2026 | 2027 | 2028 | 2029 | 2030 | 2031 | 2032 | 2033 | 2034 | |
| Levered FCF (£, Millions) | UK£227.4m | UK£261.0m | UK£259.7m | UK£273.0m | UK£283.4m | UK£292.5m | UK£300.8m | UK£308.6m | UK£315.9m | UK£323.0m |
| Growth Rate Estimate Source | Analyst x6 | Analyst x6 | Analyst x5 | Analyst x1 | Est @ 3.79% | Est @ 3.23% | Est @ 2.84% | Est @ 2.57% | Est @ 2.38% | Est @ 2.24% |
| Present Value (£, Millions) Discounted @ 8.5% | UK£210 | UK£222 | UK£203 | UK£197 | UK£188 | UK£179 | UK£170 | UK£160 | UK£151 | UK£142 |
("Est" = FCF growth rate estimated by Simply Wall St)
Present Value of 10-year Cash Flow (PVCF) = UK£1.8b
The second stage is also known as Terminal Value, this is the business's cash flow after the first stage. For a number of reasons a very conservative growth rate is used that cannot exceed that of a country's GDP growth. In this case we have used the 5-year average of the 10-year government bond yield (1.9%) to estimate future growth. In the same way as with the 10-year 'growth' period, we discount future cash flows to today's value, using a cost of equity of 8.5%.
Terminal Value (TV)= FCF2034 × (1 + g) ÷ (r – g) = UK£323m× (1 + 1.9%) ÷ (8.5%– 1.9%) = UK£5.0b
Present Value of Terminal Value (PVTV)= TV / (1 + r)10= UK£5.0b÷ ( 1 + 8.5%)10= UK£2.2b
The total value, or equity value, is then the sum of the present value of the future cash flows, which in this case is UK£4.0b. To get the intrinsic value per share, we divide this by the total number of shares outstanding. Compared to the current share price of UK£47.2, the company appears around fair value at the time of writing. Valuations are imprecise instruments though, rather like a telescope - move a few degrees and end up in a different galaxy. Do keep this in mind.
The Assumptions
Now the most important inputs to a discounted cash flow are the discount rate, and of course, the actual cash flows. If you don't agree with these result, have a go at the calculation yourself and play with the assumptions. The DCF also does not consider the possible cyclicality of an industry, or a company's future capital requirements, so it does not give a full picture of a company's potential performance. Given that we are looking at Berkeley Group Holdings as potential shareholders, the cost of equity is used as the discount rate, rather than the cost of capital (or weighted average cost of capital, WACC) which accounts for debt. In this calculation we've used 8.5%, which is based on a levered beta of 1.362. Beta is a measure of a stock's volatility, compared to the market as a whole. We get our beta from the industry average beta of globally comparable companies, with an imposed limit between 0.8 and 2.0, which is a reasonable range for a stable business.
SWOT Analysis for Berkeley Group Holdings
Strength
- Debt is not viewed as a risk.
- Dividends are covered by earnings and cash flows.
Weakness
- Earnings declined over the past year.
- Dividend is low compared to the top 25% of dividend payers in the Consumer Durables market.
Opportunity
- Good value based on P/E ratio compared to estimated Fair P/E ratio.
Threat
- Annual earnings are forecast to decline for the next 3 years.
Next Steps:
Although the valuation of a company is important, it shouldn't be the only metric you look at when researching a company. It's not possible to obtain a foolproof valuation with a DCF model. Rather it should be seen as a guide to "what assumptions need to be true for this stock to be under/overvalued?" If a company grows at a different rate, or if its cost of equity or risk free rate changes sharply, the output can look very different. For Berkeley Group Holdings, there are three pertinent factors you should explore:
- Risks: Every company has them, and we've spotted 2 warning signs for Berkeley Group Holdings (of which 1 can't be ignored!) you should know about.
- Management:Have insiders been ramping up their shares to take advantage of the market's sentiment for BKG's future outlook? Check out our management and board analysis with insights on CEO compensation and governance factors.
- Other High Quality Alternatives: Do you like a good all-rounder? Explore our interactive list of high quality stocks to get an idea of what else is out there you may be missing!
PS. The Simply Wall St app conducts a discounted cash flow valuation for every stock on the LSE every day. If you want to find the calculation for other stocks just search here.
Valuation is complex, but we're here to simplify it.
Discover if Berkeley Group Holdings might be undervalued or overvalued with our detailed analysis, featuring fair value estimates, potential risks, dividends, insider trades, and its financial condition.
Access Free AnalysisHave feedback on this article? Concerned about the content? Get in touch with us directly. Alternatively, email editorial-team (at) simplywallst.com.
This article by Simply Wall St is general in nature. We provide commentary based on historical data and analyst forecasts only using an unbiased methodology and our articles are not intended to be financial advice. It does not constitute a recommendation to buy or sell any stock, and does not take account of your objectives, or your financial situation. We aim to bring you long-term focused analysis driven by fundamental data. Note that our analysis may not factor in the latest price-sensitive company announcements or qualitative material. Simply Wall St has no position in any stocks mentioned.
About LSE:BKG
Berkeley Group Holdings
The Berkeley Group Holdings plc, together with its subsidiaries, builds homes and neighbourhoods in the United Kingdom.
Excellent balance sheet and fair value.
Similar Companies
Market Insights

Advertisement
Community Narratives
MicroVision will explode future revenue by 380.37% with a vision towards success
Fair Value US$60.00|98.5% undervalued
TH
Community Contributor
The Indispensable Artery for a New North American Economy
Fair Value CA$132.87|2.3% undervalued
TI
Community Contributor