
Advertisement
- United Kingdom
- /
- Luxury
- /
- AIM:MUL
The five-year underlying earnings growth at Mulberry Group (LON:MUL) is promising, but the shareholders are still in the red over that time
Generally speaking long term investing is the way to go. But that doesn't mean long term investors can avoid big losses. Zooming in on an example, the Mulberry Group plc (LON:MUL) share price dropped 57% in the last half decade. That is extremely sub-optimal, to say the least. And some of the more recent buyers are probably worried, too, with the stock falling 42% in the last year. Shareholders have had an even rougher run lately, with the share price down 24% in the last 90 days.
Given the past week has been tough on shareholders, let's investigate the fundamentals and see what we can learn.
Check out our latest analysis for Mulberry Group
To paraphrase Benjamin Graham: Over the short term the market is a voting machine, but over the long term it's a weighing machine. One way to examine how market sentiment has changed over time is to look at the interaction between a company's share price and its earnings per share (EPS).
Mulberry Group became profitable within the last five years. Most would consider that to be a good thing, so it's counter-intuitive to see the share price declining. Other metrics might give us a better handle on how its value is changing over time.
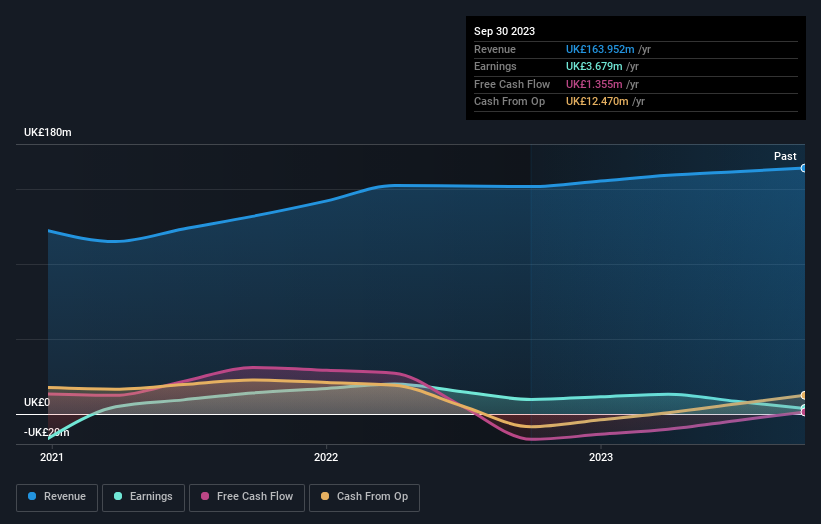
We don't think that the 0.8% is big factor in the share price, since it's quite small, as dividends go. The revenue decline of 0.9% isn't too bad. But it's quite possible the market had expected better; a closer look at the revenue trends might explain the pessimism.
You can see how earnings and revenue have changed over time in the image below (click on the chart to see the exact values).
This free interactive report on Mulberry Group's balance sheet strength is a great place to start, if you want to investigate the stock further.
A Different Perspective
While the broader market lost about 1.2% in the twelve months, Mulberry Group shareholders did even worse, losing 42% (even including dividends). However, it could simply be that the share price has been impacted by broader market jitters. It might be worth keeping an eye on the fundamentals, in case there's a good opportunity. Unfortunately, last year's performance may indicate unresolved challenges, given that it was worse than the annualised loss of 9% over the last half decade. We realise that Baron Rothschild has said investors should "buy when there is blood on the streets", but we caution that investors should first be sure they are buying a high quality business. It's always interesting to track share price performance over the longer term. But to understand Mulberry Group better, we need to consider many other factors. Case in point: We've spotted 5 warning signs for Mulberry Group you should be aware of.
If you are like me, then you will not want to miss this free list of growing companies that insiders are buying.
Please note, the market returns quoted in this article reflect the market weighted average returns of stocks that currently trade on British exchanges.
New: Manage All Your Stock Portfolios in One Place
We've created the ultimate portfolio companion for stock investors, and it's free.
• Connect an unlimited number of Portfolios and see your total in one currency
• Be alerted to new Warning Signs or Risks via email or mobile
• Track the Fair Value of your stocks
Have feedback on this article? Concerned about the content? Get in touch with us directly. Alternatively, email editorial-team (at) simplywallst.com.
This article by Simply Wall St is general in nature. We provide commentary based on historical data and analyst forecasts only using an unbiased methodology and our articles are not intended to be financial advice. It does not constitute a recommendation to buy or sell any stock, and does not take account of your objectives, or your financial situation. We aim to bring you long-term focused analysis driven by fundamental data. Note that our analysis may not factor in the latest price-sensitive company announcements or qualitative material. Simply Wall St has no position in any stocks mentioned.
About AIM:MUL
Mulberry Group
Designs and manufactures fashion accessories and clothing in the United Kingdom, North America, Asia Pacific, and internationally.
Good value with low risk.
Market Insights

Advertisement
Community Narratives
MINISO's fair value is projected at 26.69 with an anticipated PE ratio shift of 20x
Fair Value US$24.03|12.0% undervalued
BE
Community Contributor
Procter & Gamble: A Dividend Giant Facing Slowing Growth
Fair Value US$119.81|21.7% overvalued
AN
Community Contributor
Eli Lilly's Future Growth Driven by Tirzepatide and Favorable Market Conditions
Fair Value US$1.19k|14.1% undervalued
EA
Community Contributor