
Advertisement
- United Kingdom
- /
- Professional Services
- /
- AIM:STAF
Staffline Group (LON:STAF) May Have Issues Allocating Its Capital
To avoid investing in a business that's in decline, there's a few financial metrics that can provide early indications of aging. A business that's potentially in decline often shows two trends, a return on capital employed (ROCE) that's declining, and a base of capital employed that's also declining. This indicates the company is producing less profit from its investments and its total assets are decreasing. And from a first read, things don't look too good at Staffline Group (LON:STAF), so let's see why.
What Is Return On Capital Employed (ROCE)?
For those that aren't sure what ROCE is, it measures the amount of pre-tax profits a company can generate from the capital employed in its business. To calculate this metric for Staffline Group, this is the formula:
Return on Capital Employed = Earnings Before Interest and Tax (EBIT) ÷ (Total Assets - Current Liabilities)
0.052 = UK£4.0m ÷ (UK£236m - UK£159m) (Based on the trailing twelve months to December 2022).
Therefore, Staffline Group has an ROCE of 5.2%. Ultimately, that's a low return and it under-performs the Professional Services industry average of 16%.
See our latest analysis for Staffline Group
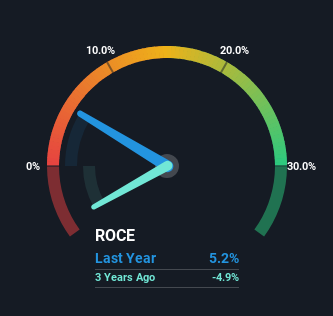
In the above chart we have measured Staffline Group's prior ROCE against its prior performance, but the future is arguably more important. If you'd like to see what analysts are forecasting going forward, you should check out our free report for Staffline Group.
SWOT Analysis for Staffline Group
Strength
- Earnings growth over the past year exceeded the industry.
- Debt is well covered by cash flow.
Weakness
- Interest payments on debt are not well covered.
Opportunity
- Annual earnings are forecast to grow faster than the British market.
- Good value based on P/E ratio and estimated fair value.
Threat
- No apparent threats visible for STAF.
So How Is Staffline Group's ROCE Trending?
The trend of ROCE at Staffline Group is showing some signs of weakness. The company used to generate 19% on its capital five years ago but it has since fallen noticeably. What's equally concerning is that the amount of capital deployed in the business has shrunk by 46% over that same period. The combination of lower ROCE and less capital employed can indicate that a business is likely to be facing some competitive headwinds or seeing an erosion to its moat. If these underlying trends continue, we wouldn't be too optimistic going forward.
While on the subject, we noticed that the ratio of current liabilities to total assets has risen to 67%, which has impacted the ROCE. If current liabilities hadn't increased as much as they did, the ROCE could actually be even lower. And with current liabilities at these levels, suppliers or short-term creditors are effectively funding a large part of the business, which can introduce some risks.
What We Can Learn From Staffline Group's ROCE
In summary, it's unfortunate that Staffline Group is shrinking its capital base and also generating lower returns. This could explain why the stock has sunk a total of 97% in the last five years. With underlying trends that aren't great in these areas, we'd consider looking elsewhere.
If you want to continue researching Staffline Group, you might be interested to know about the 2 warning signs that our analysis has discovered.
For those who like to invest in solid companies, check out this free list of companies with solid balance sheets and high returns on equity.
New: Manage All Your Stock Portfolios in One Place
We've created the ultimate portfolio companion for stock investors, and it's free.
• Connect an unlimited number of Portfolios and see your total in one currency
• Be alerted to new Warning Signs or Risks via email or mobile
• Track the Fair Value of your stocks
Have feedback on this article? Concerned about the content? Get in touch with us directly. Alternatively, email editorial-team (at) simplywallst.com.
This article by Simply Wall St is general in nature. We provide commentary based on historical data and analyst forecasts only using an unbiased methodology and our articles are not intended to be financial advice. It does not constitute a recommendation to buy or sell any stock, and does not take account of your objectives, or your financial situation. We aim to bring you long-term focused analysis driven by fundamental data. Note that our analysis may not factor in the latest price-sensitive company announcements or qualitative material. Simply Wall St has no position in any stocks mentioned.
About AIM:STAF
Staffline Group
Provides recruitment and outsourced human resource services in the United Kingdom and the Republic of Ireland.
Undervalued with adequate balance sheet.
Similar Companies
Market Insights


Advertisement
Community Narratives
The Next Phase of Energy Storage: How NeoVolta Is Tackling America’s Power Crunch
Fair Value US$7.50|40.5% undervalued
MA
Community Contributor
Why EnSilica is Worth Possibly 13x its Current Price
Fair Value UK£5.00|91.8% undervalued
DO
Community Contributor
M&A Activity, Industry Diversification & A Defense Contract Monopoly Will Push BWXT For Healthy Long-Term Growth
Fair Value US$220.00|16.2% undervalued
CL
Community Contributor
A case for Cassiar Gold Corp (TSXV: GLDC) to reach CAD$8-10 before 2030 (X30-37)
Fair Value CA$10.00|97.5% undervalued
AG
Community Contributor