
Key Insights
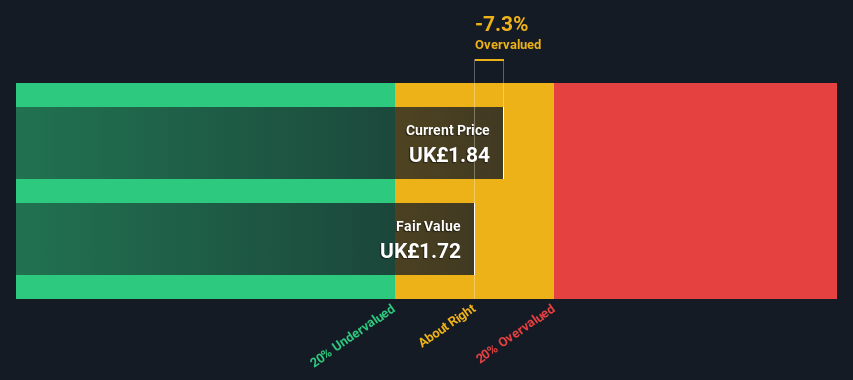
- The projected fair value for Norcros is UK£1.72 based on 2 Stage Free Cash Flow to Equity
- Current share price of UK£1.84 suggests Norcros is potentially trading close to its fair value
- Our fair value estimate is 44% lower than Norcros' analyst price target of UK£3.08
Today we'll do a simple run through of a valuation method used to estimate the attractiveness of Norcros plc (LON:NXR) as an investment opportunity by taking the expected future cash flows and discounting them to their present value. We will take advantage of the Discounted Cash Flow (DCF) model for this purpose. Don't get put off by the jargon, the math behind it is actually quite straightforward.
We generally believe that a company's value is the present value of all of the cash it will generate in the future. However, a DCF is just one valuation metric among many, and it is not without flaws. For those who are keen learners of equity analysis, the Simply Wall St analysis model here may be something of interest to you.
See our latest analysis for Norcros
The Method
We are going to use a two-stage DCF model, which, as the name states, takes into account two stages of growth. The first stage is generally a higher growth period which levels off heading towards the terminal value, captured in the second 'steady growth' period. To begin with, we have to get estimates of the next ten years of cash flows. Where possible we use analyst estimates, but when these aren't available we extrapolate the previous free cash flow (FCF) from the last estimate or reported value. We assume companies with shrinking free cash flow will slow their rate of shrinkage, and that companies with growing free cash flow will see their growth rate slow, over this period. We do this to reflect that growth tends to slow more in the early years than it does in later years.
Generally we assume that a dollar today is more valuable than a dollar in the future, so we need to discount the sum of these future cash flows to arrive at a present value estimate:
10-year free cash flow (FCF) forecast
| 2024 | 2025 | 2026 | 2027 | 2028 | 2029 | 2030 | 2031 | 2032 | 2033 | |
| Levered FCF (£, Millions) | UK£18.6m | UK£22.6m | UK£17.5m | UK£15.5m | UK£14.4m | UK£13.7m | UK£13.3m | UK£13.1m | UK£13.0m | UK£13.0m |
| Growth Rate Estimate Source | Analyst x4 | Analyst x4 | Analyst x1 | Est @ -11.35% | Est @ -7.49% | Est @ -4.79% | Est @ -2.89% | Est @ -1.57% | Est @ -0.64% | Est @ 0.01% |
| Present Value (£, Millions) Discounted @ 10% | UK£16.8 | UK£18.5 | UK£13.0 | UK£10.4 | UK£8.8 | UK£7.6 | UK£6.6 | UK£5.9 | UK£5.3 | UK£4.8 |
("Est" = FCF growth rate estimated by Simply Wall St)
Present Value of 10-year Cash Flow (PVCF) = UK£98m
We now need to calculate the Terminal Value, which accounts for all the future cash flows after this ten year period. For a number of reasons a very conservative growth rate is used that cannot exceed that of a country's GDP growth. In this case we have used the 5-year average of the 10-year government bond yield (1.5%) to estimate future growth. In the same way as with the 10-year 'growth' period, we discount future cash flows to today's value, using a cost of equity of 10%.
Terminal Value (TV)= FCF2033 × (1 + g) ÷ (r – g) = UK£13m× (1 + 1.5%) ÷ (10%– 1.5%) = UK£149m
Present Value of Terminal Value (PVTV)= TV / (1 + r)10= UK£149m÷ ( 1 + 10%)10= UK£55m
The total value, or equity value, is then the sum of the present value of the future cash flows, which in this case is UK£153m. In the final step we divide the equity value by the number of shares outstanding. Compared to the current share price of UK£1.8, the company appears around fair value at the time of writing. The assumptions in any calculation have a big impact on the valuation, so it is better to view this as a rough estimate, not precise down to the last cent.
The Assumptions
Now the most important inputs to a discounted cash flow are the discount rate, and of course, the actual cash flows. Part of investing is coming up with your own evaluation of a company's future performance, so try the calculation yourself and check your own assumptions. The DCF also does not consider the possible cyclicality of an industry, or a company's future capital requirements, so it does not give a full picture of a company's potential performance. Given that we are looking at Norcros as potential shareholders, the cost of equity is used as the discount rate, rather than the cost of capital (or weighted average cost of capital, WACC) which accounts for debt. In this calculation we've used 10%, which is based on a levered beta of 1.501. Beta is a measure of a stock's volatility, compared to the market as a whole. We get our beta from the industry average beta of globally comparable companies, with an imposed limit between 0.8 and 2.0, which is a reasonable range for a stable business.
SWOT Analysis for Norcros
- Debt is not viewed as a risk.
- Dividends are covered by earnings and cash flows.
- Earnings declined over the past year.
- Dividend is low compared to the top 25% of dividend payers in the Building market.
- Annual earnings are forecast to grow faster than the British market.
- Good value based on P/E ratio compared to estimated Fair P/E ratio.
- Annual revenue is expected to decline over the next 3 years.
Next Steps:
Whilst important, the DCF calculation ideally won't be the sole piece of analysis you scrutinize for a company. DCF models are not the be-all and end-all of investment valuation. Rather it should be seen as a guide to "what assumptions need to be true for this stock to be under/overvalued?" If a company grows at a different rate, or if its cost of equity or risk free rate changes sharply, the output can look very different. For Norcros, we've put together three relevant items you should further examine:
- Risks: We feel that you should assess the 2 warning signs for Norcros we've flagged before making an investment in the company.
- Future Earnings: How does NXR's growth rate compare to its peers and the wider market? Dig deeper into the analyst consensus number for the upcoming years by interacting with our free analyst growth expectation chart.
- Other High Quality Alternatives: Do you like a good all-rounder? Explore our interactive list of high quality stocks to get an idea of what else is out there you may be missing!
PS. Simply Wall St updates its DCF calculation for every British stock every day, so if you want to find the intrinsic value of any other stock just search here.
The New Payments ETF Is Live on NASDAQ:
Money is moving to real-time rails, and a newly listed ETF now gives investors direct exposure. Fast settlement. Institutional custody. Simple access.
Explore how this launch could reshape portfolios
Sponsored ContentValuation is complex, but we're here to simplify it.
Discover if Norcros might be undervalued or overvalued with our detailed analysis, featuring fair value estimates, potential risks, dividends, insider trades, and its financial condition.
Access Free AnalysisHave feedback on this article? Concerned about the content? Get in touch with us directly. Alternatively, email editorial-team (at) simplywallst.com.
This article by Simply Wall St is general in nature. We provide commentary based on historical data and analyst forecasts only using an unbiased methodology and our articles are not intended to be financial advice. It does not constitute a recommendation to buy or sell any stock, and does not take account of your objectives, or your financial situation. We aim to bring you long-term focused analysis driven by fundamental data. Note that our analysis may not factor in the latest price-sensitive company announcements or qualitative material. Simply Wall St has no position in any stocks mentioned.
About LSE:NXR
Norcros
Designs and supplies bathroom and kitchen products in the United Kingdom, Ireland, and South Africa.
Flawless balance sheet, undervalued and pays a dividend.
Similar Companies
Market Insights

Weekly Picks

Early mover in a fast growing industry. Likely to experience share price volatility as they scale


A case for CA$31.80 (undiluted), aka 8,616% upside from CA$0.37 (an 86 bagger!).


Moderation and Stabilisation: HOLD: Fair Price based on a 4-year Cycle is $12.08
Recently Updated Narratives

Airbnb Stock: Platform Growth in a World of Saturation and Scrutiny

Adobe Stock: AI-Fueled ARR Growth Pushes Guidance Higher, But Cost Pressures Loom

Thomson Reuters Stock: When Legal Intelligence Becomes Mission-Critical Infrastructure
Popular Narratives


Crazy Undervalued 42 Baggers Silver Play (Active & Running Mine)


NVDA: Expanding AI Demand Will Drive Major Data Center Investments Through 2026

The AI Infrastructure Giant Grows Into Its Valuation
Trending Discussion


