Stock Analysis
- United Kingdom
- /
- Construction
- /
- LSE:MGNS
M.P. Evans Group Leads Three Key Dividend Stocks In The UK

Reviewed by Simply Wall St

The United Kingdom stock market has experienced a slight decline of 1.0% over the last week, although it has seen an overall increase of 8.0% in the past year with earnings expected to grow by 13% annually. In this context, identifying stocks like M.P. Evans Group that offer robust dividends can provide investors with potential steady income streams amid fluctuating market conditions.
Top 10 Dividend Stocks In The United Kingdom
| Name | Dividend Yield | Dividend Rating |
| Record (LSE:REC) | 7.79% | ★★★★★★ |
| Keller Group (LSE:KLR) | 3.30% | ★★★★★☆ |
| Dunelm Group (LSE:DNLM) | 7.32% | ★★★★★☆ |
| DCC (LSE:DCC) | 3.47% | ★★★★★☆ |
| Plus500 (LSE:PLUS) | 6.12% | ★★★★★☆ |
| Big Yellow Group (LSE:BYG) | 3.70% | ★★★★★☆ |
| Grafton Group (LSE:GFTU) | 3.57% | ★★★★★☆ |
| Rio Tinto Group (LSE:RIO) | 5.85% | ★★★★★☆ |
| NWF Group (AIM:NWF) | 3.75% | ★★★★★☆ |
| Hargreaves Services (AIM:HSP) | 6.64% | ★★★★★☆ |
Click here to see the full list of 55 stocks from our Top Dividend Stocks screener.
Below we spotlight a couple of our favorites from our exclusive screener.
M.P. Evans Group (AIM:MPE)
Simply Wall St Dividend Rating: ★★★★☆☆
Overview: M.P. Evans Group PLC operates in the agricultural sector, focusing on owning and developing oil palm plantations in Indonesia and Malaysia, with a market capitalization of approximately £457.42 million.
Operations: M.P. Evans Group PLC generates $307.32 million from its plantation operations in Indonesia.
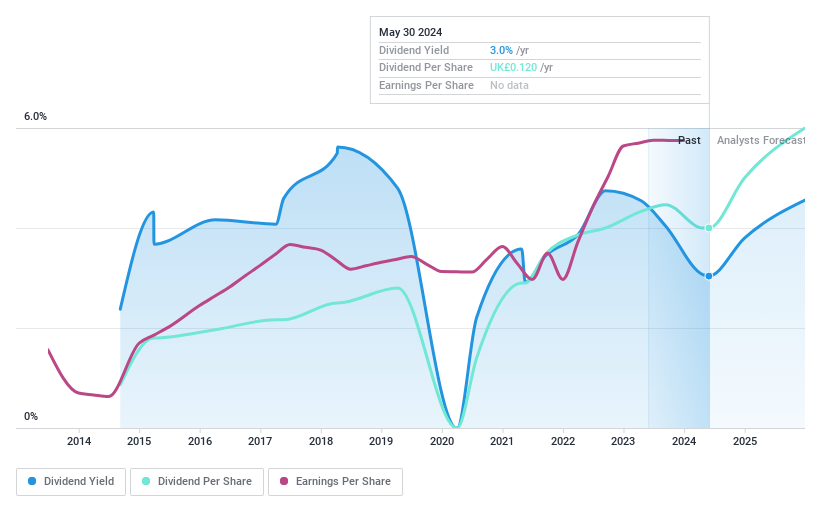
Dividend Yield: 5%
M.P. Evans Group PLC, a UK-based company, reported a decrease in annual sales to US$307.37 million and net income to US$52.49 million for 2023. Despite this downturn, the company increased its final dividend to 32.5 pence per share, totaling US$17.3 million payable in June 2024. The dividend coverage remains solid with a payout ratio of 58.7% and cash payout ratio of 64.6%, indicating sustainability from both earnings and cash flow perspectives despite past volatility in dividend payments.
- Delve into the full analysis dividend report here for a deeper understanding of M.P. Evans Group.
- The valuation report we've compiled suggests that M.P. Evans Group's current price could be quite moderate.
Property Franchise Group (AIM:TPFG)
Simply Wall St Dividend Rating: ★★★★☆☆
Overview: The Property Franchise Group PLC, with a market capitalization of £249.31 million, operates in the United Kingdom where it manages and leases residential real estate properties.
Operations: The Property Franchise Group PLC generates revenue primarily through two segments: Financial Services (£1.50 million) and Property Franchising (£25.78 million).
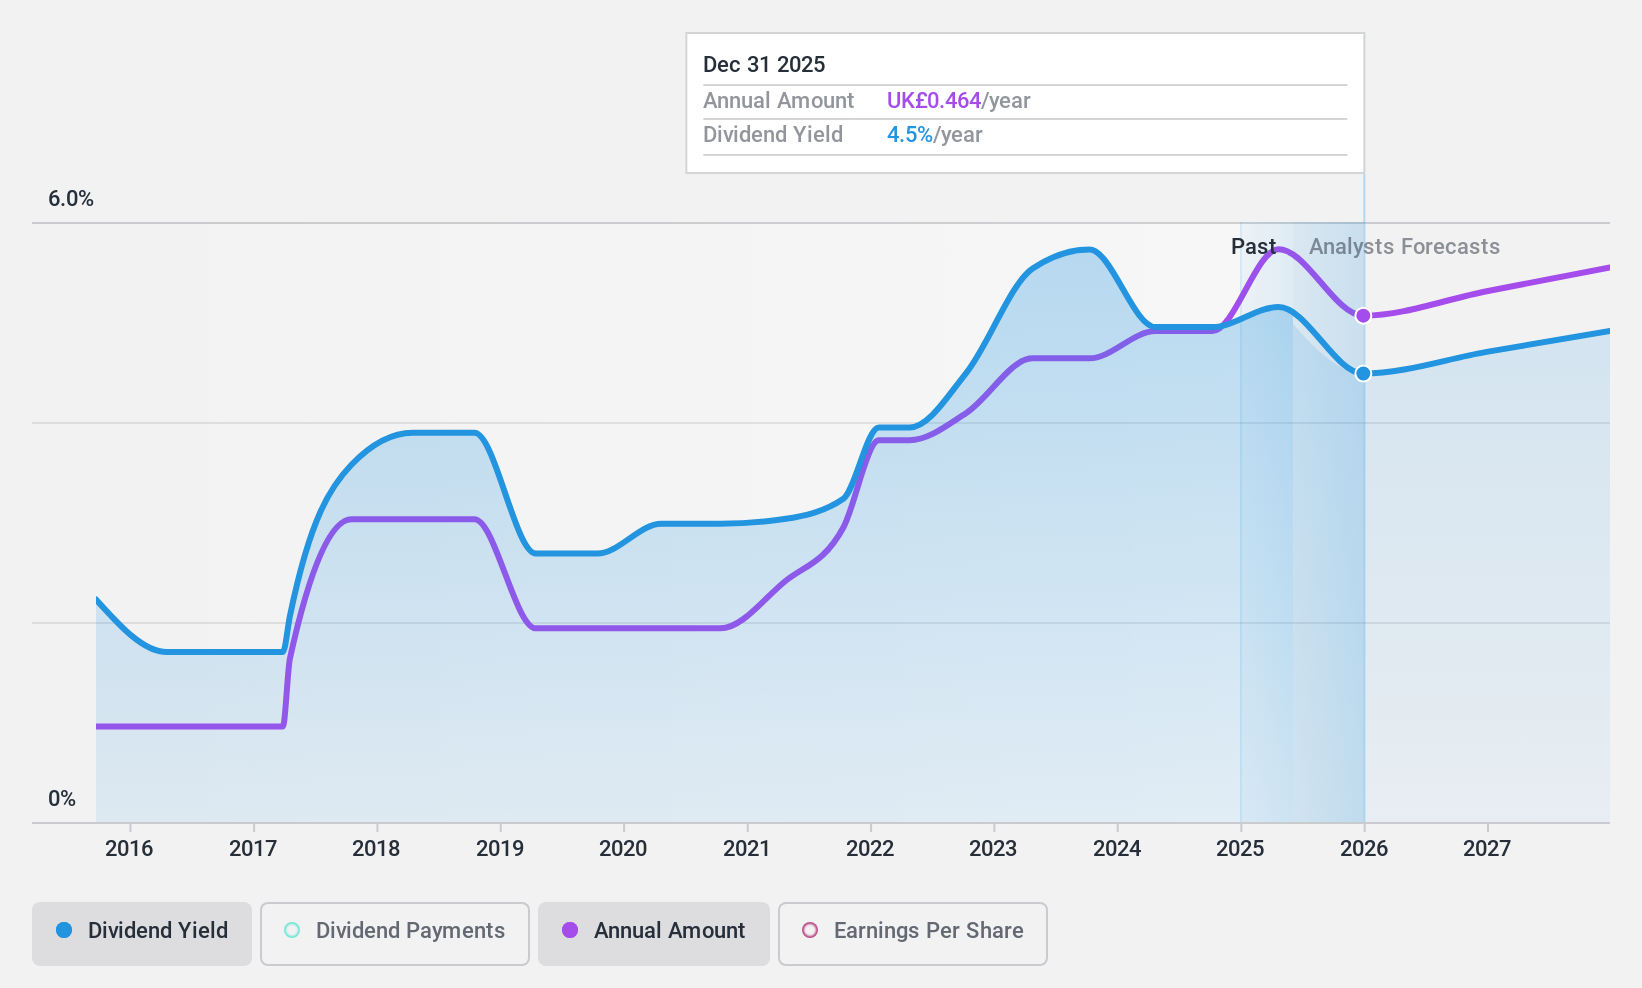
Dividend Yield: 3%
Property Franchise Group PLC reported a slight increase in annual sales to £27.28 million and net income to £7.4 million for 2023. The company declared a cash dividend of £0.074 per share, payable in May 2024. With a payout ratio of 52.2% and a cash payout ratio of 85.4%, dividends are well-covered by both earnings and cash flow, despite an unstable dividend track record over the past decade and volatility in payments. Trading at 50.5% below estimated fair value suggests potential undervaluation, although its dividend yield at 3% remains low compared to top UK dividend payers.
- Click here and access our complete dividend analysis report to understand the dynamics of Property Franchise Group.
- Our valuation report unveils the possibility Property Franchise Group's shares may be trading at a discount.
Morgan Sindall Group (LSE:MGNS)
Simply Wall St Dividend Rating: ★★★★☆☆
Overview: Morgan Sindall Group plc is a UK-based construction and regeneration company with a market capitalization of approximately £1.16 billion.
Operations: Morgan Sindall Group plc generates revenue through several key segments, including Fit Out (£1.11 billion), Construction (£966.60 million), Infrastructure (£886.70 million), Partnership Housing (£837.50 million), Property Services (£185.20 million), and Urban Regeneration (£185.30 million).
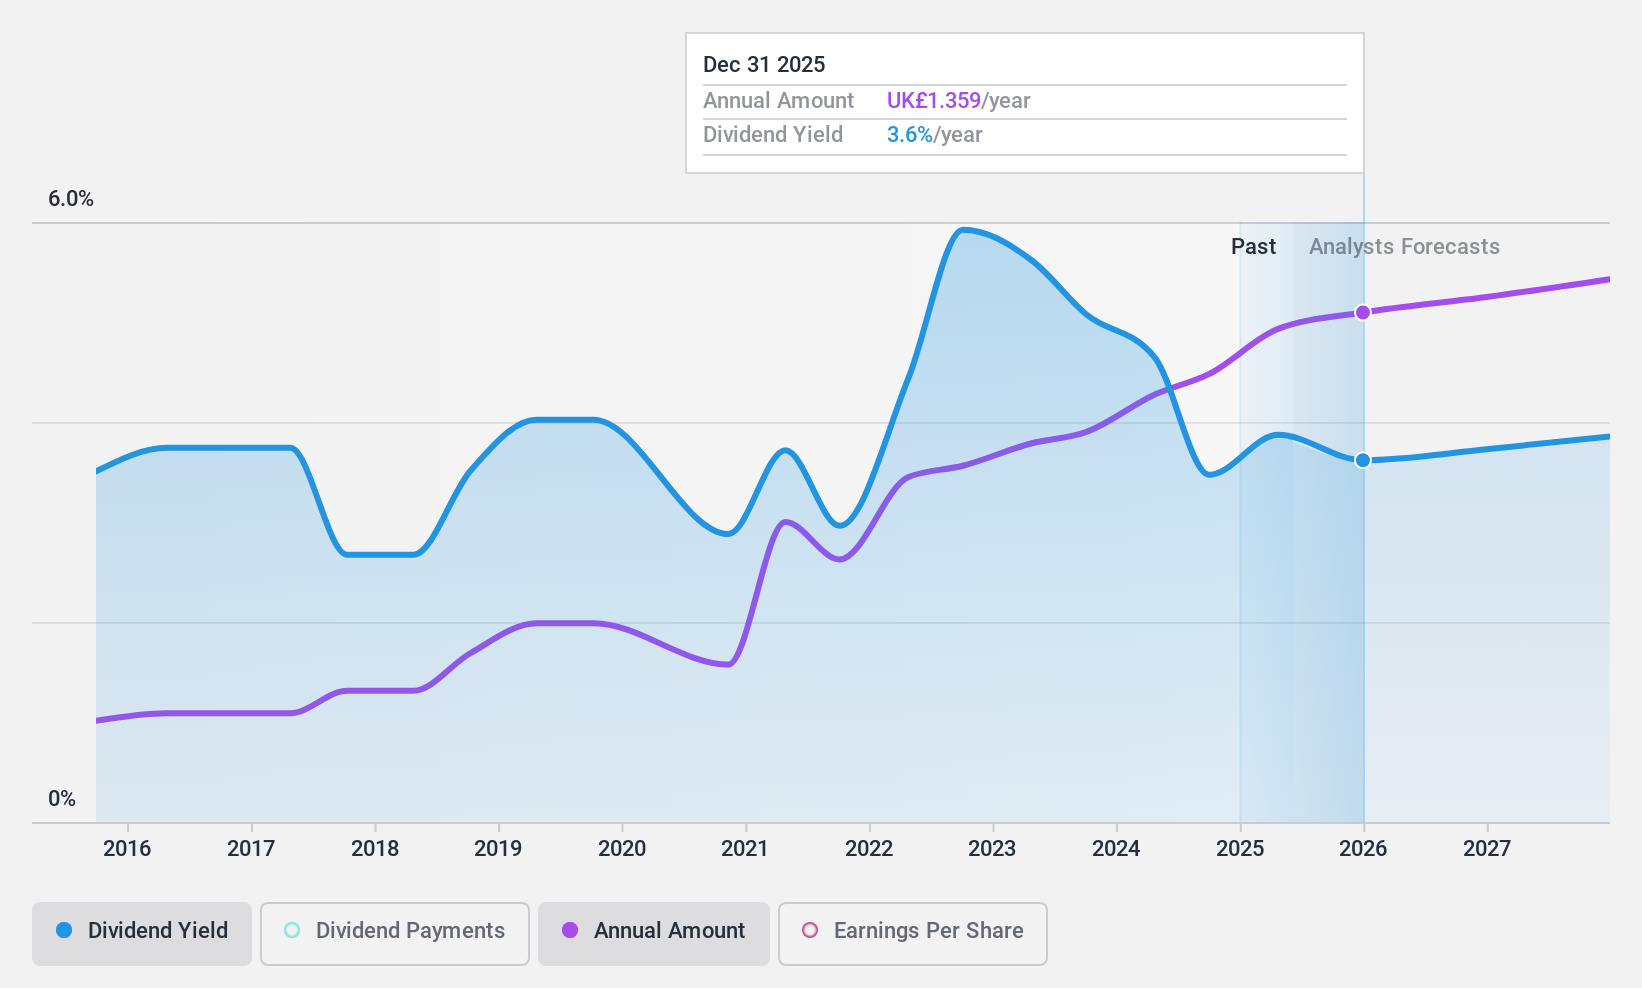
Dividend Yield: 4.6%
Morgan Sindall Group plc, trading at 30% below estimated fair value, offers a dividend yield of 4.56%, which is modest compared to the UK's top quartile. Despite a recent dividend increase to £0.78 per share, the firm's decade-long dividend history shows volatility and inconsistency in payments. However, both earnings and cash flows substantially cover these dividends, with payout ratios of 44.8% and 29.1% respectively, supporting potential sustainability amidst an unstable track record. Recent executive changes and positive corporate guidance for 2024 indicate ongoing strategic adjustments.
- Get an in-depth perspective on Morgan Sindall Group's performance by reading our dividend report here.
- In light of our recent valuation report, it seems possible that Morgan Sindall Group is trading behind its estimated value.
Where To Now?
- Click here to access our complete index of 55 Top Dividend Stocks.
- Got skin in the game with these stocks? Elevate how you manage them by using Simply Wall St's portfolio, where intuitive tools await to help optimize your investment outcomes.
- Join a community of smart investors by using Simply Wall St. It's free and delivers expert-level analysis on worldwide markets.
Interested In Other Possibilities?
- Explore high-performing small cap companies that haven't yet garnered significant analyst attention.
- Fuel your portfolio with companies showing strong growth potential, backed by optimistic outlooks both from analysts and management.
- Find companies with promising cash flow potential yet trading below their fair value.
This article by Simply Wall St is general in nature. We provide commentary based on historical data and analyst forecasts only using an unbiased methodology and our articles are not intended to be financial advice. It does not constitute a recommendation to buy or sell any stock, and does not take account of your objectives, or your financial situation. We aim to bring you long-term focused analysis driven by fundamental data. Note that our analysis may not factor in the latest price-sensitive company announcements or qualitative material. Simply Wall St has no position in any stocks mentioned.
Valuation is complex, but we're helping make it simple.
Find out whether Morgan Sindall Group is potentially over or undervalued by checking out our comprehensive analysis, which includes fair value estimates, risks and warnings, dividends, insider transactions and financial health.
View the Free AnalysisHave feedback on this article? Concerned about the content? Get in touch with us directly. Alternatively, email editorial-team@simplywallst.com
About LSE:MGNS
Morgan Sindall Group
Operates as a construction and regeneration company in the United Kingdom.
Outstanding track record, undervalued and pays a dividend.
