
Advertisement
- United Kingdom
- /
- Construction
- /
- LSE:MGNS
Investors Should Be Encouraged By Morgan Sindall Group's (LON:MGNS) Returns On Capital
What are the early trends we should look for to identify a stock that could multiply in value over the long term? Firstly, we'd want to identify a growing return on capital employed (ROCE) and then alongside that, an ever-increasing base of capital employed. Ultimately, this demonstrates that it's a business that is reinvesting profits at increasing rates of return. With that in mind, the ROCE of Morgan Sindall Group (LON:MGNS) looks great, so lets see what the trend can tell us.
Understanding Return On Capital Employed (ROCE)
If you haven't worked with ROCE before, it measures the 'return' (pre-tax profit) a company generates from capital employed in its business. Analysts use this formula to calculate it for Morgan Sindall Group:
Return on Capital Employed = Earnings Before Interest and Tax (EBIT) ÷ (Total Assets - Current Liabilities)
0.22 = UK£129m ÷ (UK£1.7b - UK£1.1b) (Based on the trailing twelve months to June 2022).
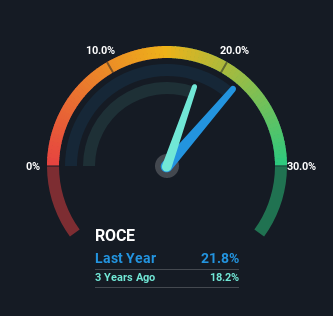
Thus, Morgan Sindall Group has an ROCE of 22%. That's a fantastic return and not only that, it outpaces the average of 8.5% earned by companies in a similar industry.
View our latest analysis for Morgan Sindall Group
Above you can see how the current ROCE for Morgan Sindall Group compares to its prior returns on capital, but there's only so much you can tell from the past. If you'd like to see what analysts are forecasting going forward, you should check out our free report for Morgan Sindall Group.
So How Is Morgan Sindall Group's ROCE Trending?
Morgan Sindall Group is displaying some positive trends. Over the last five years, returns on capital employed have risen substantially to 22%. Basically the business is earning more per dollar of capital invested and in addition to that, 84% more capital is being employed now too. This can indicate that there's plenty of opportunities to invest capital internally and at ever higher rates, a combination that's common among multi-baggers.
On a separate but related note, it's important to know that Morgan Sindall Group has a current liabilities to total assets ratio of 64%, which we'd consider pretty high. This effectively means that suppliers (or short-term creditors) are funding a large portion of the business, so just be aware that this can introduce some elements of risk. Ideally we'd like to see this reduce as that would mean fewer obligations bearing risks.
The Key Takeaway
A company that is growing its returns on capital and can consistently reinvest in itself is a highly sought after trait, and that's what Morgan Sindall Group has. And with a respectable 73% awarded to those who held the stock over the last five years, you could argue that these developments are starting to get the attention they deserve. So given the stock has proven it has promising trends, it's worth researching the company further to see if these trends are likely to persist.
Since virtually every company faces some risks, it's worth knowing what they are, and we've spotted 2 warning signs for Morgan Sindall Group (of which 1 is a bit unpleasant!) that you should know about.
If you'd like to see other companies earning high returns, check out our free list of companies earning high returns with solid balance sheets here.
New: Manage All Your Stock Portfolios in One Place
We've created the ultimate portfolio companion for stock investors, and it's free.
• Connect an unlimited number of Portfolios and see your total in one currency
• Be alerted to new Warning Signs or Risks via email or mobile
• Track the Fair Value of your stocks
Have feedback on this article? Concerned about the content? Get in touch with us directly. Alternatively, email editorial-team (at) simplywallst.com.
This article by Simply Wall St is general in nature. We provide commentary based on historical data and analyst forecasts only using an unbiased methodology and our articles are not intended to be financial advice. It does not constitute a recommendation to buy or sell any stock, and does not take account of your objectives, or your financial situation. We aim to bring you long-term focused analysis driven by fundamental data. Note that our analysis may not factor in the latest price-sensitive company announcements or qualitative material. Simply Wall St has no position in any stocks mentioned.
About LSE:MGNS
Morgan Sindall Group
Operates as a construction and regeneration company in the United Kingdom.
Outstanding track record with flawless balance sheet and pays a dividend.
Similar Companies
Market Insights

Advertisement
Community Narratives
MicroVision will explode future revenue by 380.37% with a vision towards success
Fair Value US$60|98.4% undervalued
TH
Community Contributor
The Indispensable Artery for a New North American Economy
Fair Value CA$132.87|0.7% overvalued
TI
Community Contributor
Recently Updated Narratives
CE

cementafriend on Constellation Energy ·
Constellation Energy Dividends and Growth
Fair Value:US$348.054.7% overvalued
2 followersusers have followed this narrative
0 commentsusers have commented on this narrative
0 likesusers have liked this narrative
KH

Khagani on CoreWeave ·
CoreWeave's Revenue Expected to Rocket 77.88% in 5-Year Forecast
Fair Value:US$11033.5% undervalued
4 followersusers have followed this narrative
0 commentsusers have commented on this narrative
0 likesusers have liked this narrative
PO

PortfolioPlus on Bisalloy Steel Group ·
Bisalloy Steel Group will shine with a projected profit margin increase of 12.8%
Fair Value:AU$6.7118.0% undervalued
3 followersusers have followed this narrative
0 commentsusers have commented on this narrative
0 likesusers have liked this narrative
Popular Narratives
TH

TheWallstreetKing on MicroVision ·
MicroVision will explode future revenue by 380.37% with a vision towards success
Fair Value:US$6098.4% undervalued
108 followersusers have followed this narrative
10 commentsusers have commented on this narrative
21 likesusers have liked this narrative
AN


AnalystConsensusTarget on NVIDIA ·
NVDA: Expanding AI Demand Will Drive Major Data Center Investments Through 2026
Fair Value:US$250.3929.3% undervalued
936 followersusers have followed this narrative
6 commentsusers have commented on this narrative
24 likesusers have liked this narrative
OS


oscargarcia on Alphabet ·
The company that turned a verb into a global necessity and basically runs the modern internet, digital ads, smartphones, maps, and AI.
Fair Value:US$3405.8% undervalued
144 followersusers have followed this narrative
6 commentsusers have commented on this narrative
18 likesusers have liked this narrative