
Advertisement
Kier Group (LON:KIE) Full Year 2025 Results
Key Financial Results
- Revenue: UK£4.08b (up 4.4% from FY 2024).
- Net income: UK£56.4m (up 11% from FY 2024).
- Profit margin: 1.4% (up from 1.3% in FY 2024). The increase in margin was driven by higher revenue.
- EPS: UK£0.13 (up from UK£0.12 in FY 2024).
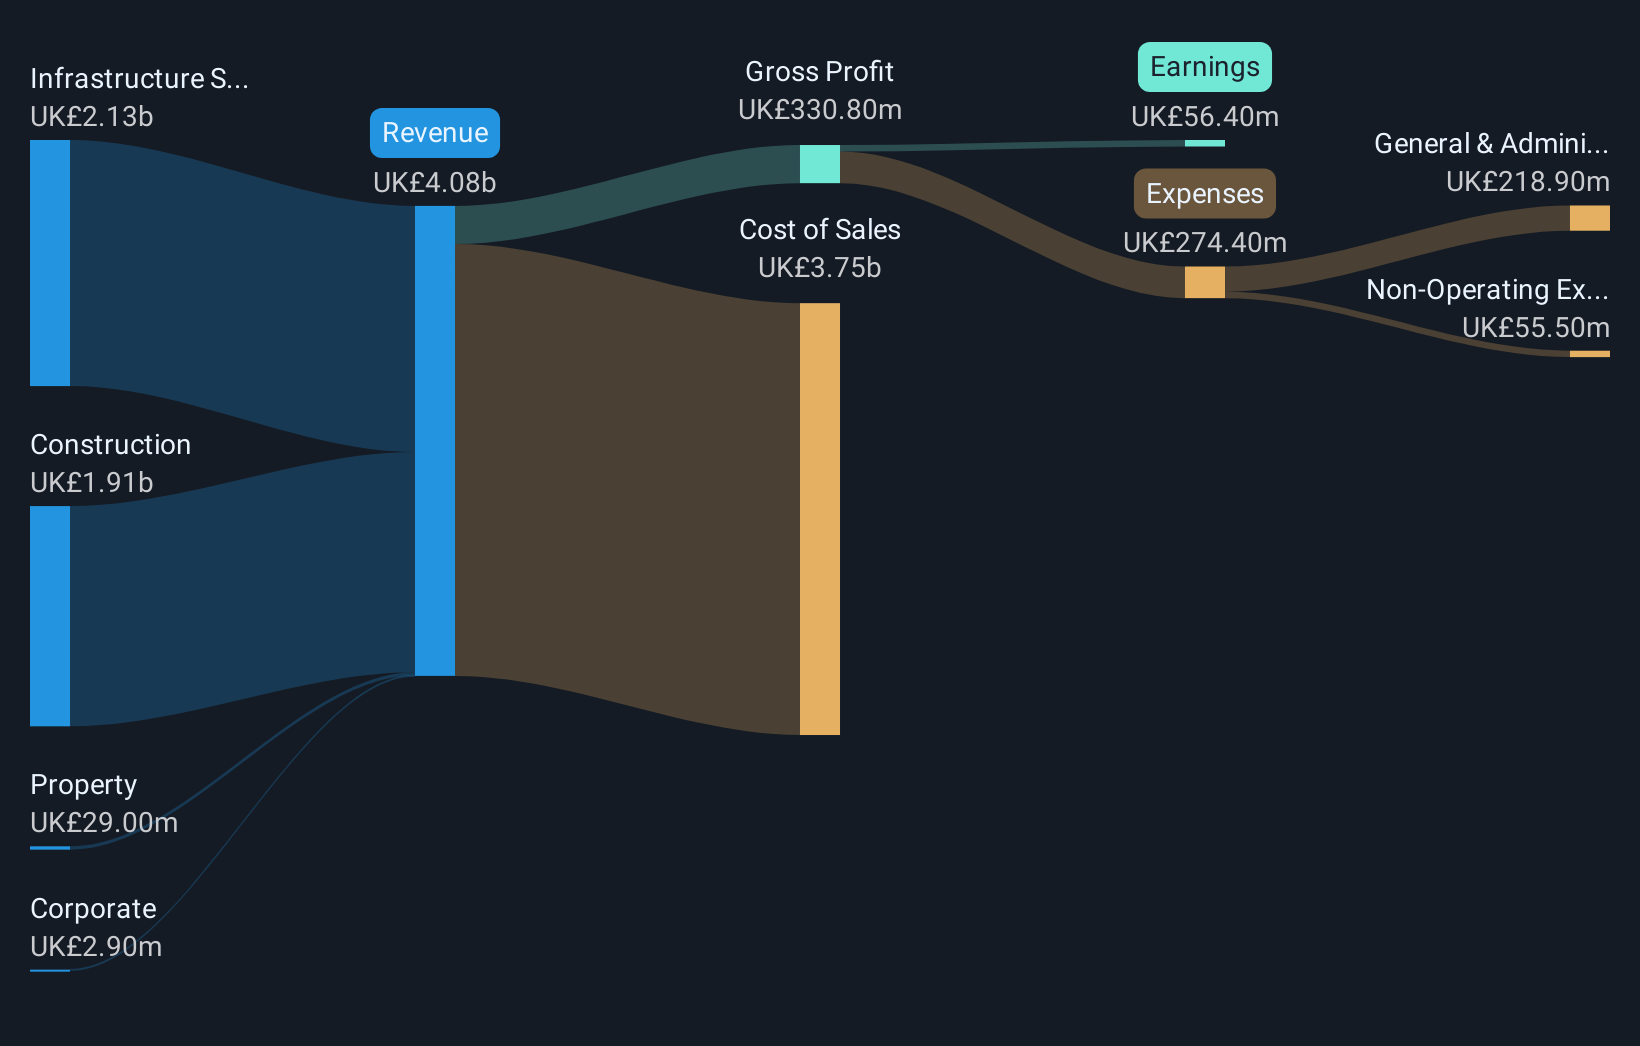
All figures shown in the chart above are for the trailing 12 month (TTM) period
Kier Group Revenues and Earnings Miss Expectations
Revenue missed analyst estimates by 2.1%. Earnings per share (EPS) also missed analyst estimates by 27%.
The primary driver behind last 12 months revenue was the Infrastructure Services segment contributing a total revenue of UK£2.13b (52% of total revenue). Notably, cost of sales worth UK£3.75b amounted to 92% of total revenue thereby underscoring the impact on earnings. The largest operating expense was General & Administrative costs, amounting to UK£218.9m (80% of total expenses). Explore how KIE's revenue and expenses shape its earnings.
Looking ahead, revenue is forecast to grow 3.4% p.a. on average during the next 3 years, compared to a 4.5% growth forecast for the Construction industry in the United Kingdom.
Performance of the British Construction industry.
The company's shares are up 10% from a week ago.
Risk Analysis
Don't forget that there may still be risks. For instance, we've identified 1 warning sign for Kier Group that you should be aware of.
Valuation is complex, but we're here to simplify it.
Discover if Kier Group might be undervalued or overvalued with our detailed analysis, featuring fair value estimates, potential risks, dividends, insider trades, and its financial condition.
Access Free AnalysisHave feedback on this article? Concerned about the content? Get in touch with us directly. Alternatively, email editorial-team (at) simplywallst.com.
This article by Simply Wall St is general in nature. We provide commentary based on historical data and analyst forecasts only using an unbiased methodology and our articles are not intended to be financial advice. It does not constitute a recommendation to buy or sell any stock, and does not take account of your objectives, or your financial situation. We aim to bring you long-term focused analysis driven by fundamental data. Note that our analysis may not factor in the latest price-sensitive company announcements or qualitative material. Simply Wall St has no position in any stocks mentioned.
About LSE:KIE
Kier Group
Primarily engages in the construction business in the United Kingdom and internationally.
Acceptable track record with mediocre balance sheet.
Similar Companies
Market Insights

Advertisement
Community Narratives
Finding The True Value Of A Logistics Powerhouse
Fair Value US$95.21|8.4% undervalued
NV
Community Contributor
Paradigm Biopharmaceuticals Will Lead Osteoarthritis Treatment with Zilosul's FDA Success
Fair Value AU$5.50|92.1% undervalued
AM
Community Contributor
Barrick Mining (ABX:CA): A Gold Hedge against a U.S. Shutdown
Fair Value CA$60.00|24.2% undervalued
GM
Community Contributor