
Advertisement
Key Insights
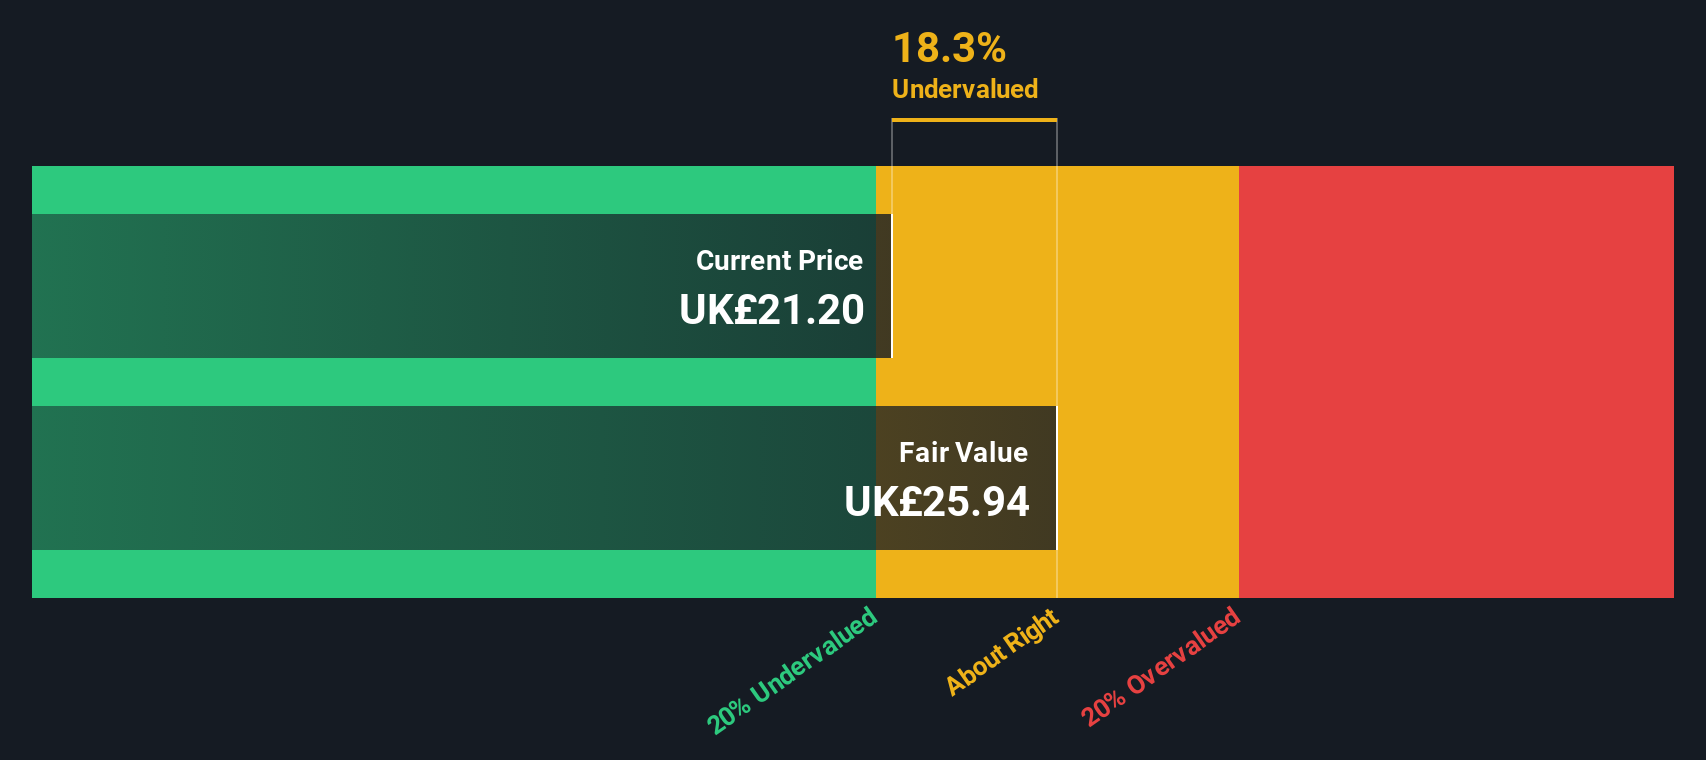
- The projected fair value for IMI is UK£25.94 based on 2 Stage Free Cash Flow to Equity
- IMI's UK£21.20 share price indicates it is trading at similar levels as its fair value estimate
- Analyst price target for IMI is UK£22.47 which is 13% below our fair value estimate
Today we'll do a simple run through of a valuation method used to estimate the attractiveness of IMI plc (LON:IMI) as an investment opportunity by projecting its future cash flows and then discounting them to today's value. One way to achieve this is by employing the Discounted Cash Flow (DCF) model. It may sound complicated, but actually it is quite simple!
We generally believe that a company's value is the present value of all of the cash it will generate in the future. However, a DCF is just one valuation metric among many, and it is not without flaws. If you want to learn more about discounted cash flow, the rationale behind this calculation can be read in detail in the Simply Wall St analysis model.
The Model
We are going to use a two-stage DCF model, which, as the name states, takes into account two stages of growth. The first stage is generally a higher growth period which levels off heading towards the terminal value, captured in the second 'steady growth' period. In the first stage we need to estimate the cash flows to the business over the next ten years. Where possible we use analyst estimates, but when these aren't available we extrapolate the previous free cash flow (FCF) from the last estimate or reported value. We assume companies with shrinking free cash flow will slow their rate of shrinkage, and that companies with growing free cash flow will see their growth rate slow, over this period. We do this to reflect that growth tends to slow more in the early years than it does in later years.
A DCF is all about the idea that a dollar in the future is less valuable than a dollar today, so we discount the value of these future cash flows to their estimated value in today's dollars:
10-year free cash flow (FCF) estimate
| 2026 | 2027 | 2028 | 2029 | 2030 | 2031 | 2032 | 2033 | 2034 | 2035 | |
| Levered FCF (£, Millions) | UK£344.4m | UK£343.5m | UK£413.0m | UK£413.0m | UK£416.1m | UK£421.5m | UK£428.6m | UK£436.8m | UK£446.1m | UK£456.1m |
| Growth Rate Estimate Source | Analyst x7 | Analyst x5 | Analyst x1 | Analyst x1 | Est @ 0.76% | Est @ 1.30% | Est @ 1.67% | Est @ 1.93% | Est @ 2.11% | Est @ 2.24% |
| Present Value (£, Millions) Discounted @ 8.3% | UK£318 | UK£293 | UK£325 | UK£301 | UK£280 | UK£262 | UK£246 | UK£232 | UK£218 | UK£206 |
("Est" = FCF growth rate estimated by Simply Wall St)
Present Value of 10-year Cash Flow (PVCF) = UK£2.7b
The second stage is also known as Terminal Value, this is the business's cash flow after the first stage. The Gordon Growth formula is used to calculate Terminal Value at a future annual growth rate equal to the 5-year average of the 10-year government bond yield of 2.5%. We discount the terminal cash flows to today's value at a cost of equity of 8.3%.
Terminal Value (TV)= FCF2035 × (1 + g) ÷ (r – g) = UK£456m× (1 + 2.5%) ÷ (8.3%– 2.5%) = UK£8.2b
Present Value of Terminal Value (PVTV)= TV / (1 + r)10= UK£8.2b÷ ( 1 + 8.3%)10= UK£3.7b
The total value, or equity value, is then the sum of the present value of the future cash flows, which in this case is UK£6.4b. To get the intrinsic value per share, we divide this by the total number of shares outstanding. Relative to the current share price of UK£21.2, the company appears about fair value at a 18% discount to where the stock price trades currently. Remember though, that this is just an approximate valuation, and like any complex formula - garbage in, garbage out.
Important Assumptions
Now the most important inputs to a discounted cash flow are the discount rate, and of course, the actual cash flows. Part of investing is coming up with your own evaluation of a company's future performance, so try the calculation yourself and check your own assumptions. The DCF also does not consider the possible cyclicality of an industry, or a company's future capital requirements, so it does not give a full picture of a company's potential performance. Given that we are looking at IMI as potential shareholders, the cost of equity is used as the discount rate, rather than the cost of capital (or weighted average cost of capital, WACC) which accounts for debt. In this calculation we've used 8.3%, which is based on a levered beta of 1.115. Beta is a measure of a stock's volatility, compared to the market as a whole. We get our beta from the industry average beta of globally comparable companies, with an imposed limit between 0.8 and 2.0, which is a reasonable range for a stable business.
Check out our latest analysis for IMI
SWOT Analysis for IMI
Strength
- Earnings growth over the past year exceeded the industry.
- Debt is well covered by earnings and cashflows.
- Dividends are covered by earnings and cash flows.
Weakness
- Earnings growth over the past year is below its 5-year average.
- Dividend is low compared to the top 25% of dividend payers in the Machinery market.
Opportunity
- Annual earnings are forecast to grow for the next 3 years.
- Current share price is below our estimate of fair value.
Threat
- Annual earnings are forecast to grow slower than the British market.
Moving On:
Valuation is only one side of the coin in terms of building your investment thesis, and it is only one of many factors that you need to assess for a company. It's not possible to obtain a foolproof valuation with a DCF model. Preferably you'd apply different cases and assumptions and see how they would impact the company's valuation. For instance, if the terminal value growth rate is adjusted slightly, it can dramatically alter the overall result. For IMI, we've put together three relevant items you should further research:
- Risks: We feel that you should assess the 1 warning sign for IMI we've flagged before making an investment in the company.
- Management:Have insiders been ramping up their shares to take advantage of the market's sentiment for IMI's future outlook? Check out our management and board analysis with insights on CEO compensation and governance factors.
- Other Solid Businesses: Low debt, high returns on equity and good past performance are fundamental to a strong business. Why not explore our interactive list of stocks with solid business fundamentals to see if there are other companies you may not have considered!
PS. Simply Wall St updates its DCF calculation for every British stock every day, so if you want to find the intrinsic value of any other stock just search here.
New: AI Stock Screener & Alerts
Our new AI Stock Screener scans the market every day to uncover opportunities.
• Dividend Powerhouses (3%+ Yield)
• Undervalued Small Caps with Insider Buying
• High growth Tech and AI Companies
Or build your own from over 50 metrics.
Have feedback on this article? Concerned about the content? Get in touch with us directly. Alternatively, email editorial-team (at) simplywallst.com.
This article by Simply Wall St is general in nature. We provide commentary based on historical data and analyst forecasts only using an unbiased methodology and our articles are not intended to be financial advice. It does not constitute a recommendation to buy or sell any stock, and does not take account of your objectives, or your financial situation. We aim to bring you long-term focused analysis driven by fundamental data. Note that our analysis may not factor in the latest price-sensitive company announcements or qualitative material. Simply Wall St has no position in any stocks mentioned.
About LSE:IMI
IMI
An engineering company, designs, manufactures, and services engineering products in the United Kingdom, Germany, rest of Europe, the United States, rest of the Americas, China, rest of the Asia Pacific, the Middle East, and Africa.
Adequate balance sheet with moderate growth potential.
Similar Companies
Market Insights

Advertisement
Community Narratives
The company that turned a verb into a global necessity and basically runs the modern internet, digital ads, smartphones, maps, and AI.
Fair Value US$300.00|7.5% undervalued
OS
Community Contributor
Flowers Foods Pays A Fair Price For Health
Fair Value US$16.12|25.4% undervalued
NV
Community Contributor
TMX Group will thrive with 33.3% profit margin and enduring market moat
Fair Value CA$49.90|3.6% overvalued
LI
Community Contributor
The "Molecular Pencil": Why Beam's Technology is Built to Win
Fair Value US$65.01|65.0% undervalued
DA
Community Contributor