
Advertisement
- United Kingdom
- /
- Construction
- /
- LSE:COST
Costain Group PLC's (LON:COST) Stock Has Been Sliding But Fundamentals Look Strong: Is The Market Wrong?
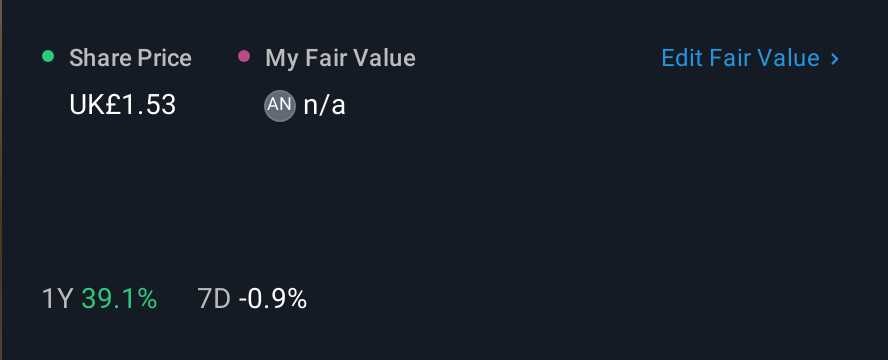
Costain Group (LON:COST) has had a rough week with its share price down 18%. However, stock prices are usually driven by a company’s financial performance over the long term, which in this case looks quite promising. Particularly, we will be paying attention to Costain Group's ROE today.
Return on Equity or ROE is a test of how effectively a company is growing its value and managing investors’ money. In short, ROE shows the profit each dollar generates with respect to its shareholder investments.
How Is ROE Calculated?
ROE can be calculated by using the formula:
Return on Equity = Net Profit (from continuing operations) ÷ Shareholders' Equity
So, based on the above formula, the ROE for Costain Group is:
13% = UK£31m ÷ UK£236m (Based on the trailing twelve months to June 2025).
The 'return' is the profit over the last twelve months. That means that for every £1 worth of shareholders' equity, the company generated £0.13 in profit.
See our latest analysis for Costain Group
Why Is ROE Important For Earnings Growth?
So far, we've learned that ROE is a measure of a company's profitability. Based on how much of its profits the company chooses to reinvest or "retain", we are then able to evaluate a company's future ability to generate profits. Generally speaking, other things being equal, firms with a high return on equity and profit retention, have a higher growth rate than firms that don’t share these attributes.
Costain Group's Earnings Growth And 13% ROE
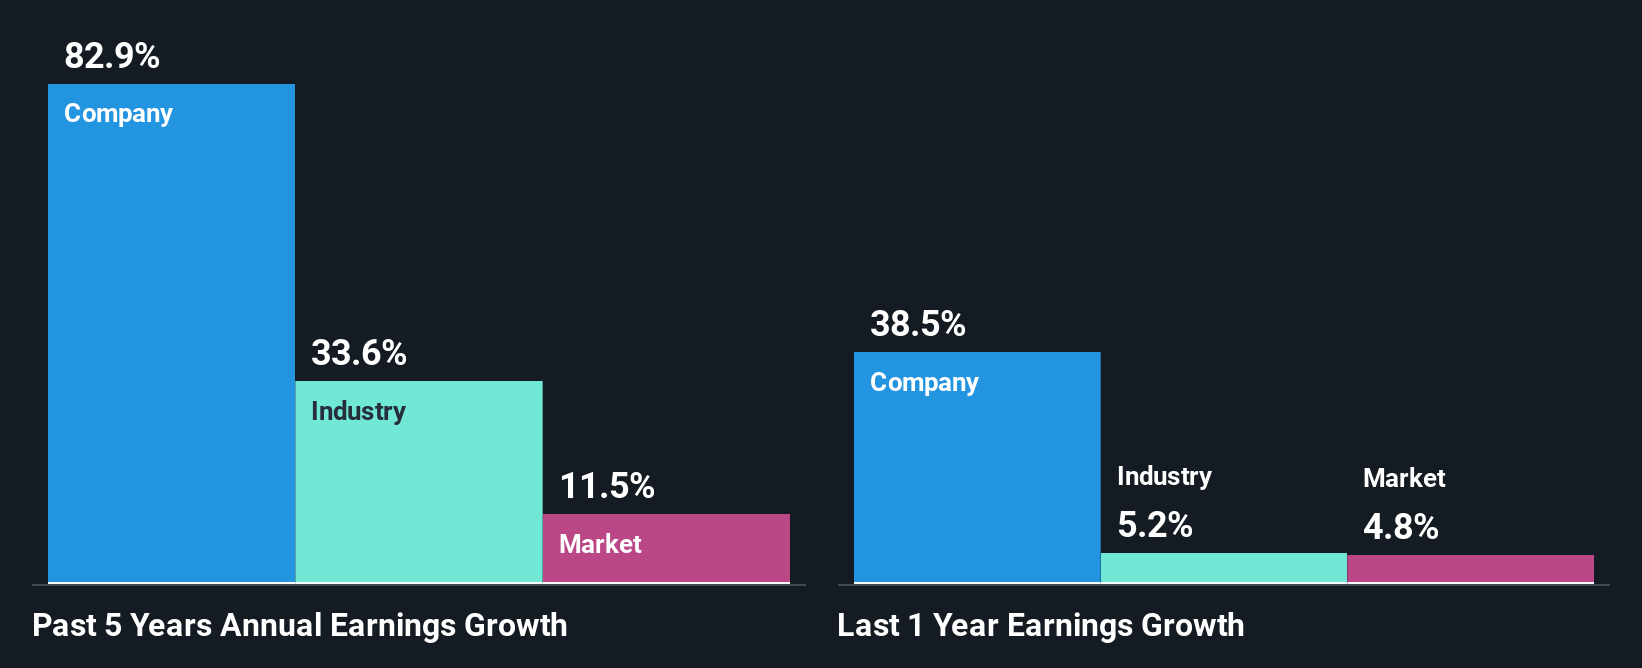
At first glance, Costain Group seems to have a decent ROE. And on comparing with the industry, we found that the the average industry ROE is similar at 15%. This certainly adds some context to Costain Group's exceptional 83% net income growth seen over the past five years. We reckon that there could also be other factors at play here. For example, it is possible that the company's management has made some good strategic decisions, or that the company has a low payout ratio.
We then compared Costain Group's net income growth with the industry and we're pleased to see that the company's growth figure is higher when compared with the industry which has a growth rate of 34% in the same 5-year period.
Earnings growth is a huge factor in stock valuation. The investor should try to establish if the expected growth or decline in earnings, whichever the case may be, is priced in. By doing so, they will have an idea if the stock is headed into clear blue waters or if swampy waters await. If you're wondering about Costain Group's's valuation, check out this gauge of its price-to-earnings ratio, as compared to its industry.
Is Costain Group Making Efficient Use Of Its Profits?
Costain Group has a really low three-year median payout ratio of 12%, meaning that it has the remaining 88% left over to reinvest into its business. This suggests that the management is reinvesting most of the profits to grow the business as evidenced by the growth seen by the company.
Moreover, Costain Group is determined to keep sharing its profits with shareholders which we infer from its long history of paying a dividend for at least ten years. Our latest analyst data shows that the future payout ratio of the company is expected to rise to 23% over the next three years. However, the company's ROE is not expected to change by much despite the higher expected payout ratio.
Conclusion
In total, we are pretty happy with Costain Group's performance. Particularly, we like that the company is reinvesting heavily into its business, and at a high rate of return. Unsurprisingly, this has led to an impressive earnings growth. Having said that, the company's earnings growth is expected to slow down, as forecasted in the current analyst estimates. Are these analysts expectations based on the broad expectations for the industry, or on the company's fundamentals? Click here to be taken to our analyst's forecasts page for the company.
New: AI Stock Screener & Alerts
Our new AI Stock Screener scans the market every day to uncover opportunities.
• Dividend Powerhouses (3%+ Yield)
• Undervalued Small Caps with Insider Buying
• High growth Tech and AI Companies
Or build your own from over 50 metrics.
Have feedback on this article? Concerned about the content? Get in touch with us directly. Alternatively, email editorial-team (at) simplywallst.com.
This article by Simply Wall St is general in nature. We provide commentary based on historical data and analyst forecasts only using an unbiased methodology and our articles are not intended to be financial advice. It does not constitute a recommendation to buy or sell any stock, and does not take account of your objectives, or your financial situation. We aim to bring you long-term focused analysis driven by fundamental data. Note that our analysis may not factor in the latest price-sensitive company announcements or qualitative material. Simply Wall St has no position in any stocks mentioned.
About LSE:COST
Costain Group
Provides infrastructure solutions for the transportation, energy, water, and defense sectors in the United Kingdom.
Flawless balance sheet and undervalued.
Similar Companies
Market Insights

Advertisement
Community Narratives
The company that turned a verb into a global necessity and basically runs the modern internet, digital ads, smartphones, maps, and AI.
Fair Value US$300.00|5.4% undervalued
OS
Community Contributor
Flowers Foods Pays A Fair Price For Health
Fair Value US$16.12|26.3% undervalued
NV
Community Contributor
TMX Group will thrive with 33.3% profit margin and enduring market moat
Fair Value CA$49.90|4.1% overvalued
LI
Community Contributor
The "Molecular Pencil": Why Beam's Technology is Built to Win
Fair Value US$65.01|62.7% undervalued
DA
Community Contributor