- United Kingdom
- /
- Aerospace & Defense
- /
- LSE:CHG
Chemring Group (LON:CHG) shareholders are still up 116% over 5 years despite pulling back 5.3% in the past week


When we invest, we're generally looking for stocks that outperform the market average. Buying under-rated businesses is one path to excess returns. For example, long term Chemring Group PLC (LON:CHG) shareholders have enjoyed a 98% share price rise over the last half decade, well in excess of the market return of around 0.6% (not including dividends). However, more recent returns haven't been as impressive as that, with the stock returning just 31% in the last year, including dividends.
Since the long term performance has been good but there's been a recent pullback of 5.3%, let's check if the fundamentals match the share price.
View our latest analysis for Chemring Group
To paraphrase Benjamin Graham: Over the short term the market is a voting machine, but over the long term it's a weighing machine. By comparing earnings per share (EPS) and share price changes over time, we can get a feel for how investor attitudes to a company have morphed over time.
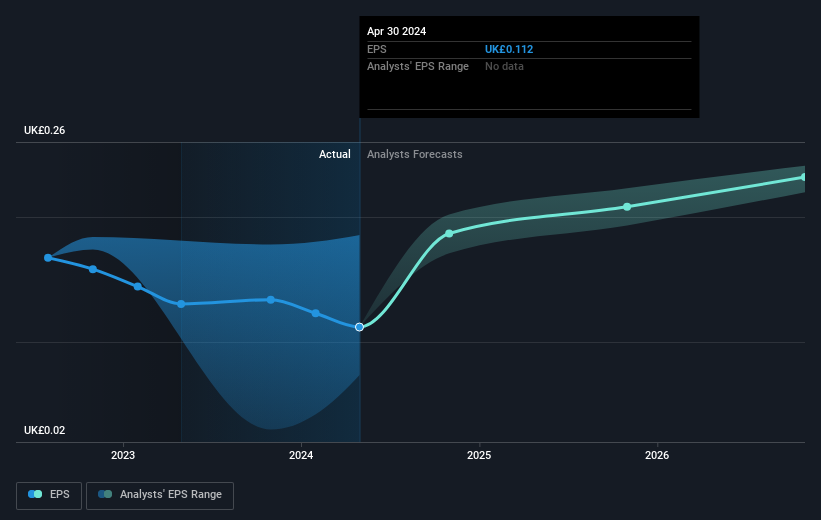
During the last half decade, Chemring Group became profitable. That would generally be considered a positive, so we'd hope to see the share price to rise.
You can see below how EPS has changed over time (discover the exact values by clicking on the image).
Before buying or selling a stock, we always recommend a close examination of historic growth trends, available here.
What About Dividends?
It is important to consider the total shareholder return, as well as the share price return, for any given stock. The TSR incorporates the value of any spin-offs or discounted capital raisings, along with any dividends, based on the assumption that the dividends are reinvested. It's fair to say that the TSR gives a more complete picture for stocks that pay a dividend. In the case of Chemring Group, it has a TSR of 116% for the last 5 years. That exceeds its share price return that we previously mentioned. And there's no prize for guessing that the dividend payments largely explain the divergence!
A Different Perspective
It's good to see that Chemring Group has rewarded shareholders with a total shareholder return of 31% in the last twelve months. That's including the dividend. That's better than the annualised return of 17% over half a decade, implying that the company is doing better recently. Someone with an optimistic perspective could view the recent improvement in TSR as indicating that the business itself is getting better with time. It's always interesting to track share price performance over the longer term. But to understand Chemring Group better, we need to consider many other factors. For example, we've discovered 2 warning signs for Chemring Group that you should be aware of before investing here.
But note: Chemring Group may not be the best stock to buy. So take a peek at this free list of interesting companies with past earnings growth (and further growth forecast).
Please note, the market returns quoted in this article reflect the market weighted average returns of stocks that currently trade on British exchanges.
New: AI Stock Screener & Alerts
Our new AI Stock Screener scans the market every day to uncover opportunities.
• Dividend Powerhouses (3%+ Yield)
• Undervalued Small Caps with Insider Buying
• High growth Tech and AI Companies
Or build your own from over 50 metrics.
Have feedback on this article? Concerned about the content? Get in touch with us directly. Alternatively, email editorial-team (at) simplywallst.com.
This article by Simply Wall St is general in nature. We provide commentary based on historical data and analyst forecasts only using an unbiased methodology and our articles are not intended to be financial advice. It does not constitute a recommendation to buy or sell any stock, and does not take account of your objectives, or your financial situation. We aim to bring you long-term focused analysis driven by fundamental data. Note that our analysis may not factor in the latest price-sensitive company announcements or qualitative material. Simply Wall St has no position in any stocks mentioned.
About LSE:CHG
Chemring Group
Provides countermeasures, sensors, information, and energetic products in the United States, the United Kingdom, Europe, the Asia pacific, and internationally.
Flawless balance sheet with reasonable growth potential.
