
Advertisement
Phil Cartmell is the CEO of TP Group plc (LON:TPG), and in this article, we analyze the executive's compensation package with respect to the overall performance of the company. This analysis will also evaluate the appropriateness of CEO compensation when taking into account the earnings and shareholder returns of the company.
Check out our latest analysis for TP Group
Comparing TP Group plc's CEO Compensation With the industry
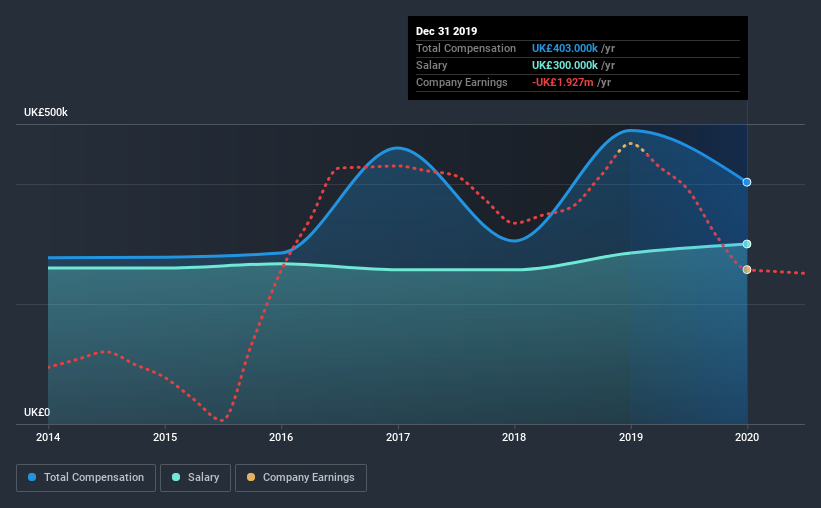
Our data indicates that TP Group plc has a market capitalization of UK£45m, and total annual CEO compensation was reported as UK£403k for the year to December 2019. That's a notable decrease of 18% on last year. In particular, the salary of UK£300.0k, makes up a huge portion of the total compensation being paid to the CEO.
For comparison, other companies in the industry with market capitalizations below UK£150m, reported a median total CEO compensation of UK£333k. From this we gather that Phil Cartmell is paid around the median for CEOs in the industry. Furthermore, Phil Cartmell directly owns UK£182k worth of shares in the company.
| Component | 2019 | 2018 | Proportion (2019) |
| Salary | UK£300k | UK£285k | 74% |
| Other | UK£103k | UK£204k | 26% |
| Total Compensation | UK£403k | UK£489k | 100% |
Speaking on an industry level, nearly 48% of total compensation represents salary, while the remainder of 52% is other remuneration. It's interesting to note that TP Group pays out a greater portion of remuneration through salary, compared to the industry. If salary dominates total compensation, it suggests that CEO compensation is leaning less towards the variable component, which is usually linked with performance.
TP Group plc's Growth
Over the last three years, TP Group plc has shrunk its earnings per share by 27% per year. It achieved revenue growth of 49% over the last year.
The reduction in EPS, over three years, is arguably concerning. But in contrast the revenue growth is strong, suggesting future potential for EPS growth. These two metrics are moving in different directions, so while it's hard to be confident judging performance, we think the stock is worth watching. We don't have analyst forecasts, but you could get a better understanding of its growth by checking out this more detailed historical graph of earnings, revenue and cash flow.
Has TP Group plc Been A Good Investment?
TP Group plc has generated a total shareholder return of 7.9% over three years, so most shareholders wouldn't be too disappointed. But they probably don't want to see the CEO paid more than is normal for companies around the same size.
To Conclude...
As we noted earlier, TP Group pays its CEO in line with similar-sized companies belonging to the same industry. But revenue growth over the last year can't be ignored. Meanwhile, we would have liked to see shareholder returns post more substantial growth. Additionally, shareholders would want to keep their eyes on EPS, since growth has been negative for the metric for the last three years. But we don't think the CEO compensation is a problem, although shareholders might want to see more growth before agreeing that Phil should get a raise.
While CEO pay is an important factor to be aware of, there are other areas that investors should be mindful of as well. We've identified 2 warning signs for TP Group that investors should be aware of in a dynamic business environment.
Of course, you might find a fantastic investment by looking at a different set of stocks. So take a peek at this free list of interesting companies.
If you decide to trade TP Group, use the lowest-cost* platform that is rated #1 Overall by Barron’s, Interactive Brokers. Trade stocks, options, futures, forex, bonds and funds on 135 markets, all from a single integrated account. Promoted
Valuation is complex, but we're here to simplify it.
Discover if TP Group might be undervalued or overvalued with our detailed analysis, featuring fair value estimates, potential risks, dividends, insider trades, and its financial condition.
Access Free AnalysisThis article by Simply Wall St is general in nature. It does not constitute a recommendation to buy or sell any stock, and does not take account of your objectives, or your financial situation. We aim to bring you long-term focused analysis driven by fundamental data. Note that our analysis may not factor in the latest price-sensitive company announcements or qualitative material. Simply Wall St has no position in any stocks mentioned.
*Interactive Brokers Rated Lowest Cost Broker by StockBrokers.com Annual Online Review 2020
Have feedback on this article? Concerned about the content? Get in touch with us directly. Alternatively, email editorial-team@simplywallst.com.
About AIM:TPG
TP Group
TP Group plc engages in consulting and engineering business, provides critical services and solutions to defense, space, and energy sector.
Adequate balance sheet and overvalued.
Market Insights

Advertisement
Community Narratives
MINISO's fair value is projected at 26.69 with an anticipated PE ratio shift of 20x
Fair Value US$24.03|11.0% undervalued
BE
Community Contributor
Procter & Gamble: A Dividend Giant Facing Slowing Growth
Fair Value US$119.81|23.3% overvalued
AN
Community Contributor
Eli Lilly's Future Growth Driven by Tirzepatide and Favorable Market Conditions
Fair Value US$1.19k|13.8% undervalued
EA
Community Contributor