
Advertisement
The external fund manager backed by Berkshire Hathaway's Charlie Munger, Li Lu, makes no bones about it when he says 'The biggest investment risk is not the volatility of prices, but whether you will suffer a permanent loss of capital.' It's only natural to consider a company's balance sheet when you examine how risky it is, since debt is often involved when a business collapses. As with many other companies Renold plc (LON:RNO) makes use of debt. But the more important question is: how much risk is that debt creating?
Why Does Debt Bring Risk?
Generally speaking, debt only becomes a real problem when a company can't easily pay it off, either by raising capital or with its own cash flow. If things get really bad, the lenders can take control of the business. However, a more common (but still painful) scenario is that it has to raise new equity capital at a low price, thus permanently diluting shareholders. Of course, debt can be an important tool in businesses, particularly capital heavy businesses. When we examine debt levels, we first consider both cash and debt levels, together.
What Is Renold's Debt?
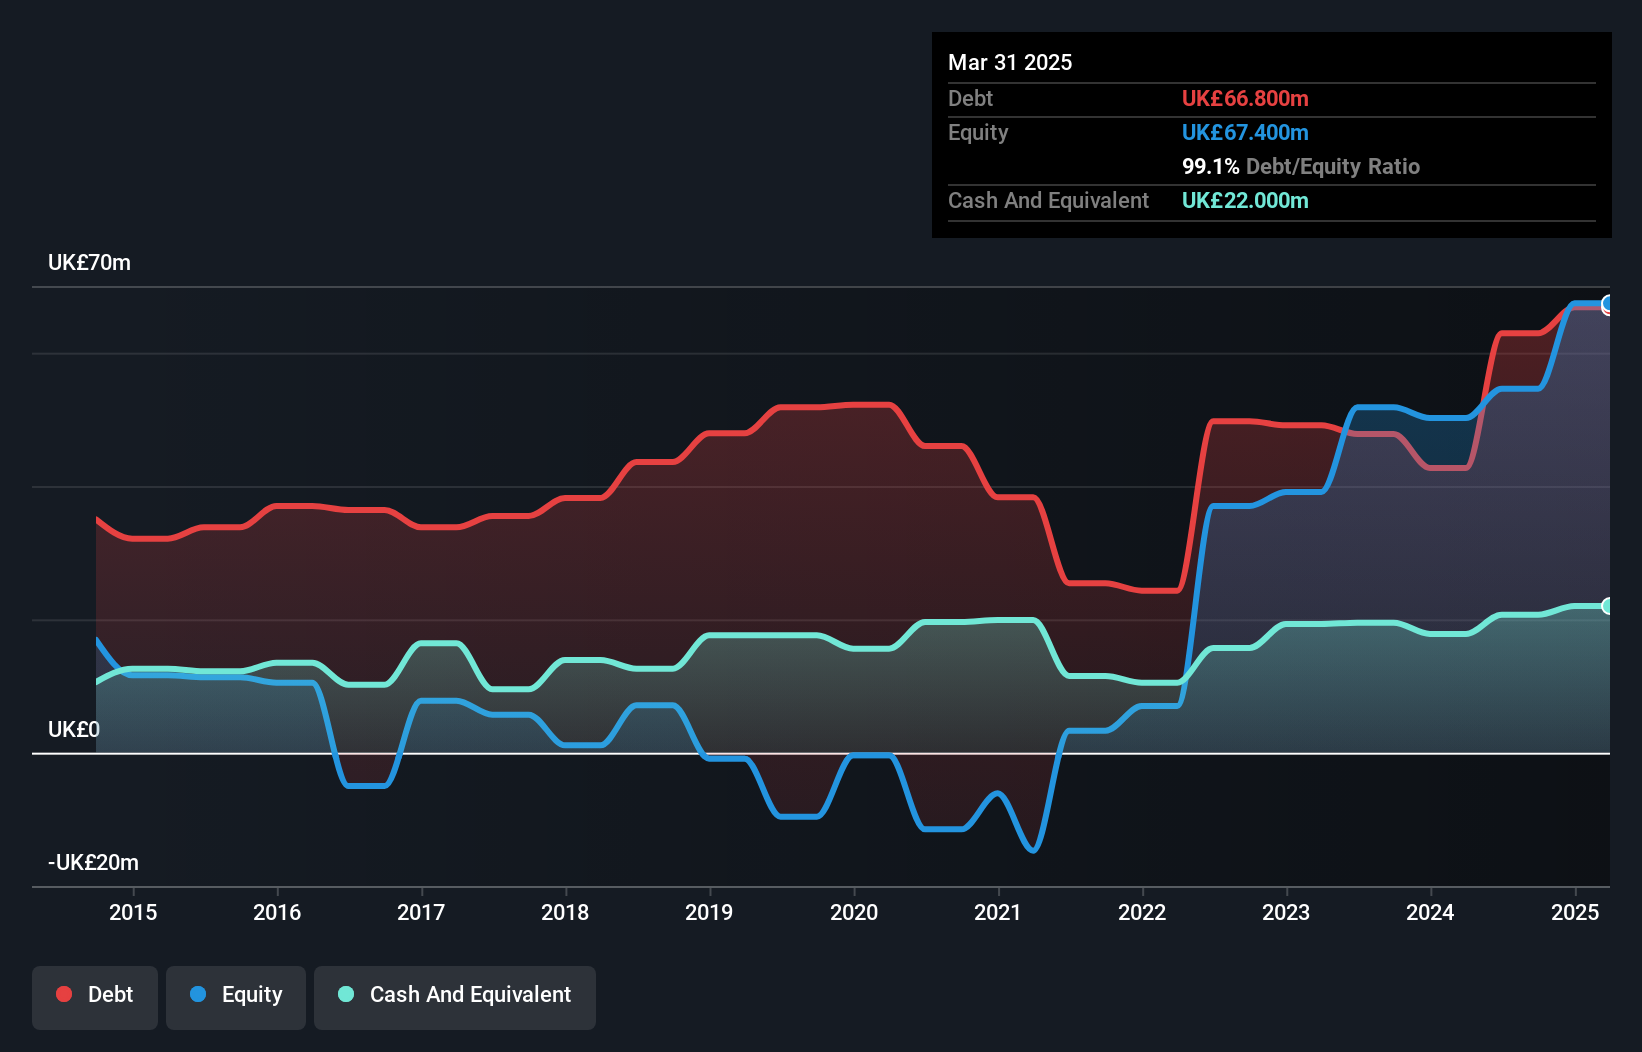
As you can see below, at the end of March 2025, Renold had UK£66.8m of debt, up from UK£42.7m a year ago. Click the image for more detail. However, because it has a cash reserve of UK£22.0m, its net debt is less, at about UK£44.8m.
How Healthy Is Renold's Balance Sheet?
We can see from the most recent balance sheet that Renold had liabilities of UK£74.1m falling due within a year, and liabilities of UK£137.2m due beyond that. On the other hand, it had cash of UK£22.0m and UK£45.3m worth of receivables due within a year. So it has liabilities totalling UK£144.0m more than its cash and near-term receivables, combined.
This is a mountain of leverage relative to its market capitalization of UK£160.4m. This suggests shareholders would be heavily diluted if the company needed to shore up its balance sheet in a hurry.
See our latest analysis for Renold
In order to size up a company's debt relative to its earnings, we calculate its net debt divided by its earnings before interest, tax, depreciation, and amortization (EBITDA) and its earnings before interest and tax (EBIT) divided by its interest expense (its interest cover). This way, we consider both the absolute quantum of the debt, as well as the interest rates paid on it.
Looking at its net debt to EBITDA of 1.2 and interest cover of 5.3 times, it seems to us that Renold is probably using debt in a pretty reasonable way. So we'd recommend keeping a close eye on the impact financing costs are having on the business. We saw Renold grow its EBIT by 9.4% in the last twelve months. Whilst that hardly knocks our socks off it is a positive when it comes to debt. There's no doubt that we learn most about debt from the balance sheet. But it is future earnings, more than anything, that will determine Renold's ability to maintain a healthy balance sheet going forward. So if you're focused on the future you can check out this free report showing analyst profit forecasts.
Finally, while the tax-man may adore accounting profits, lenders only accept cold hard cash. So we always check how much of that EBIT is translated into free cash flow. During the last three years, Renold produced sturdy free cash flow equating to 55% of its EBIT, about what we'd expect. This cold hard cash means it can reduce its debt when it wants to.
Our View
Renold's level of total liabilities was a real negative on this analysis, although the other factors we considered cast it in a significantly better light. For example, its net debt to EBITDA is relatively strong. Looking at all the angles mentioned above, it does seem to us that Renold is a somewhat risky investment as a result of its debt. That's not necessarily a bad thing, since leverage can boost returns on equity, but it is something to be aware of. When analysing debt levels, the balance sheet is the obvious place to start. But ultimately, every company can contain risks that exist outside of the balance sheet. Case in point: We've spotted 1 warning sign for Renold you should be aware of.
At the end of the day, it's often better to focus on companies that are free from net debt. You can access our special list of such companies (all with a track record of profit growth). It's free.
New: AI Stock Screener & Alerts
Our new AI Stock Screener scans the market every day to uncover opportunities.
• Dividend Powerhouses (3%+ Yield)
• Undervalued Small Caps with Insider Buying
• High growth Tech and AI Companies
Or build your own from over 50 metrics.
Have feedback on this article? Concerned about the content? Get in touch with us directly. Alternatively, email editorial-team (at) simplywallst.com.
This article by Simply Wall St is general in nature. We provide commentary based on historical data and analyst forecasts only using an unbiased methodology and our articles are not intended to be financial advice. It does not constitute a recommendation to buy or sell any stock, and does not take account of your objectives, or your financial situation. We aim to bring you long-term focused analysis driven by fundamental data. Note that our analysis may not factor in the latest price-sensitive company announcements or qualitative material. Simply Wall St has no position in any stocks mentioned.
About AIM:RNO
Renold
Engages in the manufacture and sale of high precision engineered power transmission products and solutions in the United Kingdom, rest of Europe, the United States, Canada, Australasia, China, India, and internationally.
Excellent balance sheet and fair value.
Similar Companies
Market Insights

Advertisement
Community Narratives
MicroVision will explode future revenue by 380.37% with a vision towards success
Fair Value US$60|98.4% undervalued
TH
Community Contributor
The Indispensable Artery for a New North American Economy
Fair Value CA$132.87|3.6% undervalued
TI
Community Contributor
Recently Updated Narratives
TI


TickerTickle on Oracle ·
The Quiet Giant That Became AI’s Power Grid
Fair Value:US$389.8148.6% undervalued
2 followersusers have followed this narrative
0 commentsusers have commented on this narrative
0 likesusers have liked this narrative
AU

AuCA on Nova Ljubljanska Banka d.d ·
Nova Ljubljanska Banka d.d will expect a 11.2% revenue boost driving future growth
Fair Value:€20916.0% undervalued
22 followersusers have followed this narrative
3 commentsusers have commented on this narrative
0 likesusers have liked this narrative
BI


BinocularMan on NVIDIA ·
The AI Infrastructure Giant Grows Into Its Valuation
Fair Value:US$345.0747.1% undervalued
2 followersusers have followed this narrative
0 commentsusers have commented on this narrative
0 likesusers have liked this narrative
Popular Narratives
OS


oscargarcia on Alphabet ·
The company that turned a verb into a global necessity and basically runs the modern internet, digital ads, smartphones, maps, and AI.
Fair Value:US$3406.3% undervalued
128 followersusers have followed this narrative
5 commentsusers have commented on this narrative
17 likesusers have liked this narrative
TH

TheWallstreetKing on MicroVision ·
MicroVision will explode future revenue by 380.37% with a vision towards success
Fair Value:US$6098.4% undervalued
79 followersusers have followed this narrative
10 commentsusers have commented on this narrative
16 likesusers have liked this narrative
AN

AnalystConsensusTarget on NVIDIA ·
NVDA: Expanding AI Demand Will Drive Major Data Center Investments Through 2026
Fair Value:US$232.7921.6% undervalued
915 followersusers have followed this narrative
5 commentsusers have commented on this narrative
21 likesusers have liked this narrative