
Key Insights
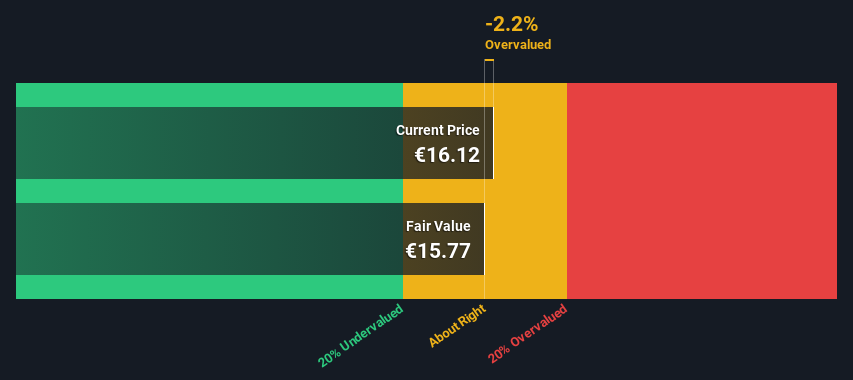
- The projected fair value for Getlink is €15.77 based on 2 Stage Free Cash Flow to Equity
- Getlink's €16.12 share price indicates it is trading at similar levels as its fair value estimate
- Analyst price target for GET is €18.16, which is 15% above our fair value estimate
Does the September share price for Getlink SE (EPA:GET) reflect what it's really worth? Today, we will estimate the stock's intrinsic value by estimating the company's future cash flows and discounting them to their present value. One way to achieve this is by employing the Discounted Cash Flow (DCF) model. Before you think you won't be able to understand it, just read on! It's actually much less complex than you'd imagine.
We would caution that there are many ways of valuing a company and, like the DCF, each technique has advantages and disadvantages in certain scenarios. If you want to learn more about discounted cash flow, the rationale behind this calculation can be read in detail in the Simply Wall St analysis model.
View our latest analysis for Getlink
What's The Estimated Valuation?
We use what is known as a 2-stage model, which simply means we have two different periods of growth rates for the company's cash flows. Generally the first stage is higher growth, and the second stage is a lower growth phase. In the first stage we need to estimate the cash flows to the business over the next ten years. Where possible we use analyst estimates, but when these aren't available we extrapolate the previous free cash flow (FCF) from the last estimate or reported value. We assume companies with shrinking free cash flow will slow their rate of shrinkage, and that companies with growing free cash flow will see their growth rate slow, over this period. We do this to reflect that growth tends to slow more in the early years than it does in later years.
Generally we assume that a dollar today is more valuable than a dollar in the future, and so the sum of these future cash flows is then discounted to today's value:
10-year free cash flow (FCF) forecast
| 2025 | 2026 | 2027 | 2028 | 2029 | 2030 | 2031 | 2032 | 2033 | 2034 | |
| Levered FCF (€, Millions) | €612.7m | €719.3m | €703.2m | €694.8m | €691.6m | €692.0m | €694.8m | €699.3m | €705.2m | €711.9m |
| Growth Rate Estimate Source | Analyst x2 | Analyst x2 | Est @ -2.23% | Est @ -1.19% | Est @ -0.46% | Est @ 0.05% | Est @ 0.41% | Est @ 0.66% | Est @ 0.83% | Est @ 0.95% |
| Present Value (€, Millions) Discounted @ 8.8% | €563 | €607 | €546 | €496 | €453 | €417 | €385 | €356 | €330 | €306 |
("Est" = FCF growth rate estimated by Simply Wall St)
Present Value of 10-year Cash Flow (PVCF) = €4.5b
The second stage is also known as Terminal Value, this is the business's cash flow after the first stage. For a number of reasons a very conservative growth rate is used that cannot exceed that of a country's GDP growth. In this case we have used the 5-year average of the 10-year government bond yield (1.2%) to estimate future growth. In the same way as with the 10-year 'growth' period, we discount future cash flows to today's value, using a cost of equity of 8.8%.
Terminal Value (TV)= FCF2034 × (1 + g) ÷ (r – g) = €712m× (1 + 1.2%) ÷ (8.8%– 1.2%) = €9.5b
Present Value of Terminal Value (PVTV)= TV / (1 + r)10= €9.5b÷ ( 1 + 8.8%)10= €4.1b
The total value, or equity value, is then the sum of the present value of the future cash flows, which in this case is €8.5b. The last step is to then divide the equity value by the number of shares outstanding. Relative to the current share price of €16.1, the company appears around fair value at the time of writing. Remember though, that this is just an approximate valuation, and like any complex formula - garbage in, garbage out.
The Assumptions
We would point out that the most important inputs to a discounted cash flow are the discount rate and of course the actual cash flows. You don't have to agree with these inputs, I recommend redoing the calculations yourself and playing with them. The DCF also does not consider the possible cyclicality of an industry, or a company's future capital requirements, so it does not give a full picture of a company's potential performance. Given that we are looking at Getlink as potential shareholders, the cost of equity is used as the discount rate, rather than the cost of capital (or weighted average cost of capital, WACC) which accounts for debt. In this calculation we've used 8.8%, which is based on a levered beta of 1.605. Beta is a measure of a stock's volatility, compared to the market as a whole. We get our beta from the industry average beta of globally comparable companies, with an imposed limit between 0.8 and 2.0, which is a reasonable range for a stable business.
SWOT Analysis for Getlink
- Debt is well covered by earnings.
- Dividends are covered by earnings and cash flows.
- Earnings declined over the past year.
- Dividend is low compared to the top 25% of dividend payers in the Infrastructure market.
- Expensive based on P/E ratio and estimated fair value.
- GET's financial characteristics indicate limited near-term opportunities for shareholders.
- Debt is not well covered by operating cash flow.
- Annual earnings are forecast to decline for the next 3 years.
Moving On:
Although the valuation of a company is important, it is only one of many factors that you need to assess for a company. It's not possible to obtain a foolproof valuation with a DCF model. Rather it should be seen as a guide to "what assumptions need to be true for this stock to be under/overvalued?" For instance, if the terminal value growth rate is adjusted slightly, it can dramatically alter the overall result. For Getlink, we've compiled three essential elements you should assess:
- Risks: Consider for instance, the ever-present spectre of investment risk. We've identified 3 warning signs with Getlink (at least 2 which are significant) , and understanding them should be part of your investment process.
- Future Earnings: How does GET's growth rate compare to its peers and the wider market? Dig deeper into the analyst consensus number for the upcoming years by interacting with our free analyst growth expectation chart.
- Other Solid Businesses: Low debt, high returns on equity and good past performance are fundamental to a strong business. Why not explore our interactive list of stocks with solid business fundamentals to see if there are other companies you may not have considered!
PS. Simply Wall St updates its DCF calculation for every French stock every day, so if you want to find the intrinsic value of any other stock just search here.
The New Payments ETF Is Live on NASDAQ:
Money is moving to real-time rails, and a newly listed ETF now gives investors direct exposure. Fast settlement. Institutional custody. Simple access.
Explore how this launch could reshape portfolios
Sponsored ContentNew: Manage All Your Stock Portfolios in One Place
We've created the ultimate portfolio companion for stock investors, and it's free.
• Connect an unlimited number of Portfolios and see your total in one currency
• Be alerted to new Warning Signs or Risks via email or mobile
• Track the Fair Value of your stocks
Have feedback on this article? Concerned about the content? Get in touch with us directly. Alternatively, email editorial-team (at) simplywallst.com.
This article by Simply Wall St is general in nature. We provide commentary based on historical data and analyst forecasts only using an unbiased methodology and our articles are not intended to be financial advice. It does not constitute a recommendation to buy or sell any stock, and does not take account of your objectives, or your financial situation. We aim to bring you long-term focused analysis driven by fundamental data. Note that our analysis may not factor in the latest price-sensitive company announcements or qualitative material. Simply Wall St has no position in any stocks mentioned.
About ENXTPA:GET
Getlink
Engages in the design, finance, construction, and operation of fixed link infrastructure and transport system in France and the United Kingdom.
Mediocre balance sheet second-rate dividend payer.
Similar Companies
Market Insights

Weekly Picks

Early mover in a fast growing industry. Likely to experience share price volatility as they scale


A case for CA$31.80 (undiluted), aka 8,616% upside from CA$0.37 (an 86 bagger!).


Moderation and Stabilisation: HOLD: Fair Price based on a 4-year Cycle is $12.08
Recently Updated Narratives


Title: Market Sentiment Is Dead Wrong — Here's Why PSEC Deserves a Second Look


An amazing opportunity to potentially get a 100 bagger

Amazon: Why the World’s Biggest Platform Still Runs on Invisible Economics
Popular Narratives


Crazy Undervalued 42 Baggers Silver Play (Active & Running Mine)


MicroVision will explode future revenue by 380.37% with a vision towards success


NVDA: Expanding AI Demand Will Drive Major Data Center Investments Through 2026
Trending Discussion
