- France
- /
- Electronic Equipment and Components
- /
- ENXTPA:ALWEC
Return Trends At We.Connect (EPA:ALWEC) Aren't Appealing

If we want to find a stock that could multiply over the long term, what are the underlying trends we should look for? Amongst other things, we'll want to see two things; firstly, a growing return on capital employed (ROCE) and secondly, an expansion in the company's amount of capital employed. This shows us that it's a compounding machine, able to continually reinvest its earnings back into the business and generate higher returns. So, when we ran our eye over We.Connect's (EPA:ALWEC) trend of ROCE, we liked what we saw.
Return On Capital Employed (ROCE): What Is It?
If you haven't worked with ROCE before, it measures the 'return' (pre-tax profit) a company generates from capital employed in its business. Analysts use this formula to calculate it for We.Connect:
Return on Capital Employed = Earnings Before Interest and Tax (EBIT) ÷ (Total Assets - Current Liabilities)
0.12 = €11m ÷ (€172m - €80m) (Based on the trailing twelve months to June 2023).
So, We.Connect has an ROCE of 12%. On its own, that's a standard return, however it's much better than the 7.3% generated by the Electronic industry.
View our latest analysis for We.Connect
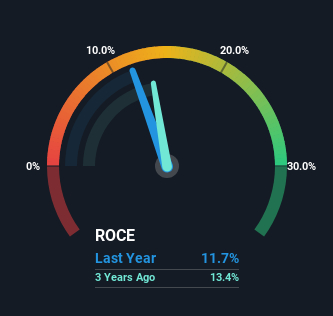
Historical performance is a great place to start when researching a stock so above you can see the gauge for We.Connect's ROCE against it's prior returns. If you're interested in investigating We.Connect's past further, check out this free graph covering We.Connect's past earnings, revenue and cash flow.
What Does the ROCE Trend For We.Connect Tell Us?
While the returns on capital are good, they haven't moved much. The company has consistently earned 12% for the last five years, and the capital employed within the business has risen 143% in that time. 12% is a pretty standard return, and it provides some comfort knowing that We.Connect has consistently earned this amount. Stable returns in this ballpark can be unexciting, but if they can be maintained over the long run, they often provide nice rewards to shareholders.
On a separate but related note, it's important to know that We.Connect has a current liabilities to total assets ratio of 47%, which we'd consider pretty high. This effectively means that suppliers (or short-term creditors) are funding a large portion of the business, so just be aware that this can introduce some elements of risk. While it's not necessarily a bad thing, it can be beneficial if this ratio is lower.
What We Can Learn From We.Connect's ROCE
In the end, We.Connect has proven its ability to adequately reinvest capital at good rates of return. Therefore it's no surprise that shareholders have earned a respectable 53% return if they held over the last five years. So while the positive underlying trends may be accounted for by investors, we still think this stock is worth looking into further.
We.Connect does have some risks though, and we've spotted 2 warning signs for We.Connect that you might be interested in.
For those who like to invest in solid companies, check out this free list of companies with solid balance sheets and high returns on equity.
The New Payments ETF Is Live on NASDAQ:
Money is moving to real-time rails, and a newly listed ETF now gives investors direct exposure. Fast settlement. Institutional custody. Simple access.
Explore how this launch could reshape portfolios
Sponsored ContentValuation is complex, but we're here to simplify it.
Discover if We.Connect might be undervalued or overvalued with our detailed analysis, featuring fair value estimates, potential risks, dividends, insider trades, and its financial condition.
Access Free AnalysisHave feedback on this article? Concerned about the content? Get in touch with us directly. Alternatively, email editorial-team (at) simplywallst.com.
This article by Simply Wall St is general in nature. We provide commentary based on historical data and analyst forecasts only using an unbiased methodology and our articles are not intended to be financial advice. It does not constitute a recommendation to buy or sell any stock, and does not take account of your objectives, or your financial situation. We aim to bring you long-term focused analysis driven by fundamental data. Note that our analysis may not factor in the latest price-sensitive company announcements or qualitative material. Simply Wall St has no position in any stocks mentioned.
About ENXTPA:ALWEC
We.Connect
Designs, manufactures, assembles, and distributes hardware and computers, and peripheral and electronic equipment in France.
Excellent balance sheet with acceptable track record.
Market Insights

Weekly Picks

Early mover in a fast growing industry. Likely to experience share price volatility as they scale


A case for CA$31.80 (undiluted), aka 8,616% upside from CA$0.37 (an 86 bagger!).


Moderation and Stabilisation: HOLD: Fair Price based on a 4-year Cycle is $12.08
Recently Updated Narratives


Title: Market Sentiment Is Dead Wrong — Here's Why PSEC Deserves a Second Look


An amazing opportunity to potentially get a 100 bagger

Amazon: Why the World’s Biggest Platform Still Runs on Invisible Economics
Popular Narratives


Crazy Undervalued 42 Baggers Silver Play (Active & Running Mine)


MicroVision will explode future revenue by 380.37% with a vision towards success


NVDA: Expanding AI Demand Will Drive Major Data Center Investments Through 2026
Trending Discussion
