European Stocks Priced Below Estimated Intrinsic Value In October 2025

Reviewed by Simply Wall St
As of October 2025, the European stock market has seen a downturn, with the pan-European STOXX Europe 600 Index falling by 1.10% amid profit-taking after reaching record highs and ongoing political turmoil in France. Despite these challenges, investors are keenly interested in stocks that are priced below their estimated intrinsic value, as these may present opportunities for growth when market conditions stabilize.
Top 10 Undervalued Stocks Based On Cash Flows In Europe
| Name | Current Price | Fair Value (Est) | Discount (Est) |
| Vimi Fasteners (BIT:VIM) | €1.15 | €2.27 | 49.4% |
| Mo-BRUK (WSE:MBR) | PLN295.00 | PLN582.68 | 49.4% |
| Micro Systemation (OM:MSAB B) | SEK62.00 | SEK122.75 | 49.5% |
| Lingotes Especiales (BME:LGT) | €5.70 | €11.23 | 49.2% |
| DigiTouch (BIT:DGT) | €1.92 | €3.79 | 49.3% |
| Digital Workforce Services Oyj (HLSE:DWF) | €3.35 | €6.64 | 49.5% |
| Bilendi (ENXTPA:ALBLD) | €21.80 | €43.21 | 49.5% |
| Atea (OB:ATEA) | NOK143.20 | NOK282.10 | 49.2% |
| Aquafil (BIT:ECNL) | €1.94 | €3.85 | 49.5% |
| Aker BioMarine (OB:AKBM) | NOK86.30 | NOK170.38 | 49.3% |
Here we highlight a subset of our preferred stocks from the screener.
B&S Group (ENXTAM:BSGR)
Overview: B&S Group S.A. is a global distributor of consumer goods with a market cap of €498.33 million.
Operations: Revenue segments for B&S Group S.A. include the distribution of consumer goods globally.
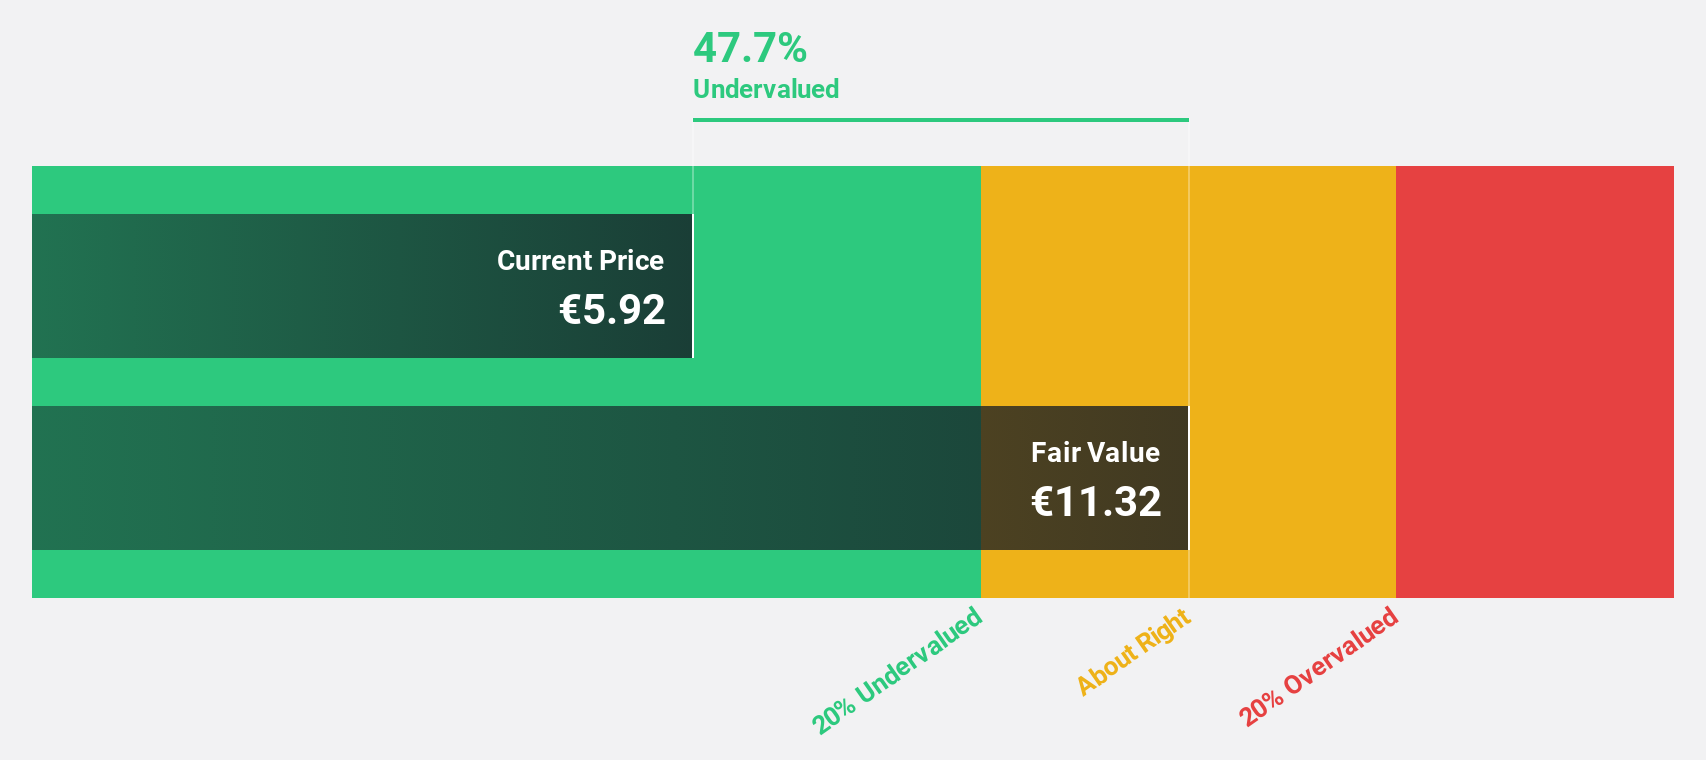
Estimated Discount To Fair Value: 47.6%
B&S Group is trading at €5.92, significantly below its estimated fair value of €11.29, presenting a potential opportunity for value investors focused on cash flows. Despite having a high level of debt and an unstable dividend track record, the company's earnings are forecast to grow significantly by 30% annually over the next three years, outpacing the Dutch market's growth rate. Recent financial results show improved net income of €31.34 million for H1 2025 from €13.23 million last year.
- Our comprehensive growth report raises the possibility that B&S Group is poised for substantial financial growth.
- Click to explore a detailed breakdown of our findings in B&S Group's balance sheet health report.
Sword Group (ENXTPA:SWP)
Overview: Sword Group S.E. offers IT and software solutions globally, with a market cap of €343.43 million.
Operations: The company's revenue is derived from its IT and software solutions, with €108.49 million from Services in Belux, €124.26 million from Switzerland, and €109.19 million from the United Kingdom.
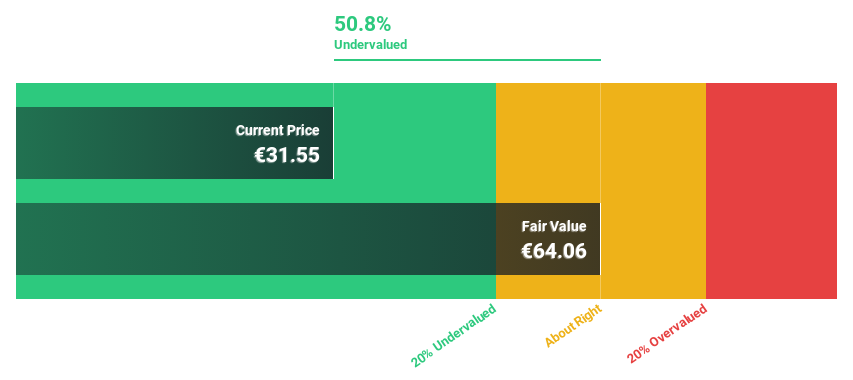
Estimated Discount To Fair Value: 36.5%
Sword Group is trading at €36.35, below its estimated fair value of €57.28, offering potential for cash flow-focused investors. Despite a dividend not well covered by earnings or free cash flows, Sword's earnings are forecast to grow 17% annually, surpassing the French market average. Recent strategic expansions in Switzerland and inclusion in the S&P Global BMI Index further bolster its growth prospects amidst reported sales of €175.81 million for H1 2025.
- Insights from our recent growth report point to a promising forecast for Sword Group's business outlook.
- Unlock comprehensive insights into our analysis of Sword Group stock in this financial health report.
Pexip Holding (OB:PEXIP)
Overview: Pexip Holding ASA is a video technology company that offers an end-to-end video conferencing platform and digital infrastructure across various regions including the Americas, Europe, the Middle East, Africa, and the Asia Pacific, with a market cap of NOK6.22 billion.
Operations: Pexip Holding generates revenue primarily through the sale of collaboration services, amounting to NOK1.19 billion.
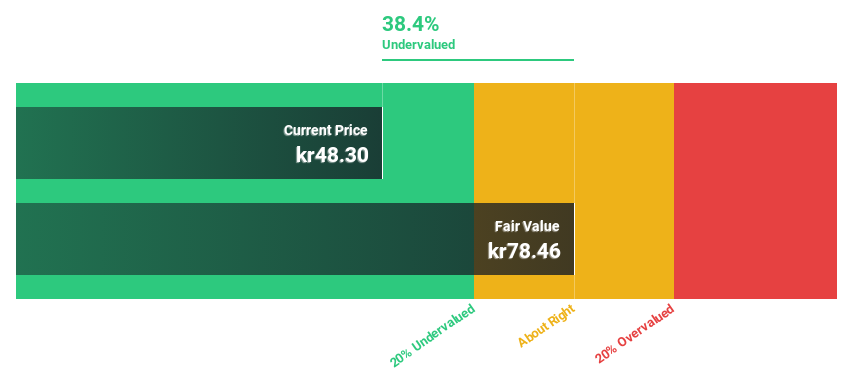
Estimated Discount To Fair Value: 41.8%
Pexip Holding, currently trading at NOK 60.7, is significantly undervalued with an estimated fair value of NOK 104.36. Despite a dividend yield of 4.12% not being well covered by earnings or free cash flows, the company's earnings are expected to grow over 20% annually, outpacing the Norwegian market average of 13.6%. Recent buyback completions and improved net income for H1 2025 further enhance its investment appeal based on cash flow valuation metrics.
- The growth report we've compiled suggests that Pexip Holding's future prospects could be on the up.
- Take a closer look at Pexip Holding's balance sheet health here in our report.
Taking Advantage
- Gain an insight into the universe of 207 Undervalued European Stocks Based On Cash Flows by clicking here.
- Hold shares in these firms? Setup your portfolio in Simply Wall St to seamlessly track your investments and receive personalized updates on your portfolio's performance.
- Take control of your financial future using Simply Wall St, offering free, in-depth knowledge of international markets to every investor.
Want To Explore Some Alternatives?
- Explore high-performing small cap companies that haven't yet garnered significant analyst attention.
- Diversify your portfolio with solid dividend payers offering reliable income streams to weather potential market turbulence.
- Fuel your portfolio with companies showing strong growth potential, backed by optimistic outlooks both from analysts and management.
This article by Simply Wall St is general in nature. We provide commentary based on historical data and analyst forecasts only using an unbiased methodology and our articles are not intended to be financial advice. It does not constitute a recommendation to buy or sell any stock, and does not take account of your objectives, or your financial situation. We aim to bring you long-term focused analysis driven by fundamental data. Note that our analysis may not factor in the latest price-sensitive company announcements or qualitative material. Simply Wall St has no position in any stocks mentioned.
The New Payments ETF Is Live on NASDAQ:
Money is moving to real-time rails, and a newly listed ETF now gives investors direct exposure. Fast settlement. Institutional custody. Simple access.
Explore how this launch could reshape portfolios
Sponsored ContentNew: Manage All Your Stock Portfolios in One Place
We've created the ultimate portfolio companion for stock investors, and it's free.
• Connect an unlimited number of Portfolios and see your total in one currency
• Be alerted to new Warning Signs or Risks via email or mobile
• Track the Fair Value of your stocks
Have feedback on this article? Concerned about the content? Get in touch with us directly. Alternatively, email editorial-team@simplywallst.com
About ENXTPA:SWP
Very undervalued with reasonable growth potential.
Similar Companies
Market Insights

Weekly Picks

Early mover in a fast growing industry. Likely to experience share price volatility as they scale


A case for CA$31.80 (undiluted), aka 8,616% upside from CA$0.37 (an 86 bagger!).


Moderation and Stabilisation: HOLD: Fair Price based on a 4-year Cycle is $12.08
Recently Updated Narratives

Airbnb Stock: Platform Growth in a World of Saturation and Scrutiny

Clarivate Stock: When Data Becomes the Backbone of Innovation and Law

Adobe Stock: AI-Fueled ARR Growth Pushes Guidance Higher, But Cost Pressures Loom
Popular Narratives


Crazy Undervalued 42 Baggers Silver Play (Active & Running Mine)


NVDA: Expanding AI Demand Will Drive Major Data Center Investments Through 2026


MicroVision will explode future revenue by 380.37% with a vision towards success
Trending Discussion
