
Advertisement
Here's Why ESI Group (EPA:ESI) Can Manage Its Debt Responsibly
Legendary fund manager Li Lu (who Charlie Munger backed) once said, 'The biggest investment risk is not the volatility of prices, but whether you will suffer a permanent loss of capital.' It's only natural to consider a company's balance sheet when you examine how risky it is, since debt is often involved when a business collapses. We note that ESI Group SA (EPA:ESI) does have debt on its balance sheet. But the more important question is: how much risk is that debt creating?
Why Does Debt Bring Risk?
Debt is a tool to help businesses grow, but if a business is incapable of paying off its lenders, then it exists at their mercy. Part and parcel of capitalism is the process of 'creative destruction' where failed businesses are mercilessly liquidated by their bankers. However, a more frequent (but still costly) occurrence is where a company must issue shares at bargain-basement prices, permanently diluting shareholders, just to shore up its balance sheet. Of course, debt can be an important tool in businesses, particularly capital heavy businesses. The first thing to do when considering how much debt a business uses is to look at its cash and debt together.
Check out our latest analysis for ESI Group
What Is ESI Group's Net Debt?
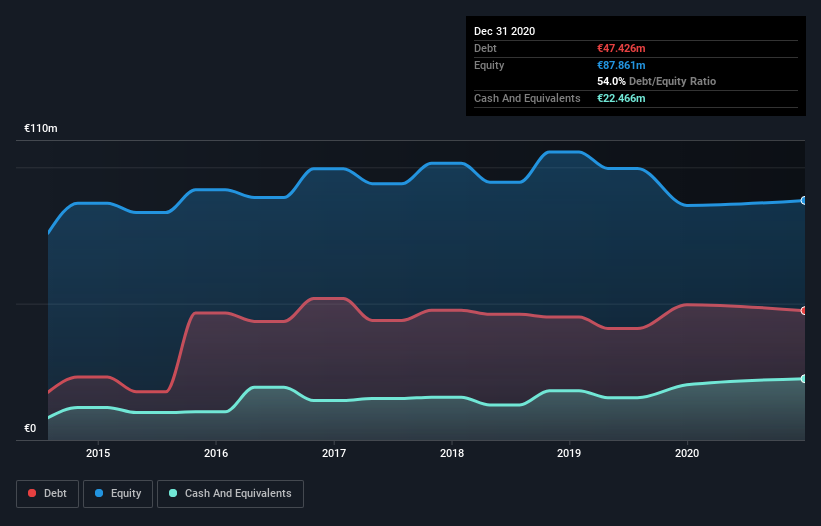
You can click the graphic below for the historical numbers, but it shows that ESI Group had €47.4m of debt in December 2020, down from €49.6m, one year before. On the flip side, it has €22.5m in cash leading to net debt of about €25.0m.
A Look At ESI Group's Liabilities
According to the last reported balance sheet, ESI Group had liabilities of €64.8m due within 12 months, and liabilities of €63.7m due beyond 12 months. Offsetting this, it had €22.5m in cash and €45.4m in receivables that were due within 12 months. So it has liabilities totalling €60.6m more than its cash and near-term receivables, combined.
Of course, ESI Group has a market capitalization of €335.8m, so these liabilities are probably manageable. Having said that, it's clear that we should continue to monitor its balance sheet, lest it change for the worse.
In order to size up a company's debt relative to its earnings, we calculate its net debt divided by its earnings before interest, tax, depreciation, and amortization (EBITDA) and its earnings before interest and tax (EBIT) divided by its interest expense (its interest cover). The advantage of this approach is that we take into account both the absolute quantum of debt (with net debt to EBITDA) and the actual interest expenses associated with that debt (with its interest cover ratio).
ESI Group has a debt to EBITDA ratio of 4.0 and its EBIT covered its interest expense 3.1 times. Taken together this implies that, while we wouldn't want to see debt levels rise, we think it can handle its current leverage. One redeeming factor for ESI Group is that it turned last year's EBIT loss into a gain of €3.9m, over the last twelve months. There's no doubt that we learn most about debt from the balance sheet. But ultimately the future profitability of the business will decide if ESI Group can strengthen its balance sheet over time. So if you're focused on the future you can check out this free report showing analyst profit forecasts.
But our final consideration is also important, because a company cannot pay debt with paper profits; it needs cold hard cash. So it is important to check how much of its earnings before interest and tax (EBIT) converts to actual free cash flow. Over the last year, ESI Group actually produced more free cash flow than EBIT. That sort of strong cash conversion gets us as excited as the crowd when the beat drops at a Daft Punk concert.
Our View
On our analysis ESI Group's conversion of EBIT to free cash flow should signal that it won't have too much trouble with its debt. But the other factors we noted above weren't so encouraging. For instance it seems like it has to struggle a bit to cover its interest expense with its EBIT. When we consider all the elements mentioned above, it seems to us that ESI Group is managing its debt quite well. Having said that, the load is sufficiently heavy that we would recommend any shareholders keep a close eye on it. When analysing debt levels, the balance sheet is the obvious place to start. But ultimately, every company can contain risks that exist outside of the balance sheet. These risks can be hard to spot. Every company has them, and we've spotted 2 warning signs for ESI Group (of which 1 can't be ignored!) you should know about.
If you're interested in investing in businesses that can grow profits without the burden of debt, then check out this free list of growing businesses that have net cash on the balance sheet.
If you decide to trade ESI Group, use the lowest-cost* platform that is rated #1 Overall by Barron’s, Interactive Brokers. Trade stocks, options, futures, forex, bonds and funds on 135 markets, all from a single integrated account. Promoted
Valuation is complex, but we're here to simplify it.
Discover if ESI Group might be undervalued or overvalued with our detailed analysis, featuring fair value estimates, potential risks, dividends, insider trades, and its financial condition.
Access Free AnalysisThis article by Simply Wall St is general in nature. It does not constitute a recommendation to buy or sell any stock, and does not take account of your objectives, or your financial situation. We aim to bring you long-term focused analysis driven by fundamental data. Note that our analysis may not factor in the latest price-sensitive company announcements or qualitative material. Simply Wall St has no position in any stocks mentioned.
*Interactive Brokers Rated Lowest Cost Broker by StockBrokers.com Annual Online Review 2020
Have feedback on this article? Concerned about the content? Get in touch with us directly. Alternatively, email editorial-team (at) simplywallst.com.
About ENXTPA:ESI
ESI Group
ESI Group SA, together with its subsidiaries, designs, develops, and distributes virtual prototyping software solutions in Europe, the Middle East, Africa, the Asia Pacific, and the Americas.
Excellent balance sheet with questionable track record.
Market Insights

Advertisement
Community Narratives
Finding The True Value Of A Logistics Powerhouse
Fair Value US$95.21|8.4% undervalued
NV
Community Contributor
Paradigm Biopharmaceuticals Will Lead Osteoarthritis Treatment with Zilosul's FDA Success
Fair Value AU$5.50|92.1% undervalued
AM
Community Contributor
Barrick Mining (ABX:CA): A Gold Hedge against a U.S. Shutdown
Fair Value CA$60.00|24.2% undervalued
GM
Community Contributor