
Advertisement
ESI Group's (EPA:ESI) Returns On Capital Not Reflecting Well On The Business
When we're researching a company, it's sometimes hard to find the warning signs, but there are some financial metrics that can help spot trouble early. A business that's potentially in decline often shows two trends, a return on capital employed (ROCE) that's declining, and a base of capital employed that's also declining. Trends like this ultimately mean the business is reducing its investments and also earning less on what it has invested. So after glancing at the trends within ESI Group (EPA:ESI), we weren't too hopeful.
What is Return On Capital Employed (ROCE)?
For those who don't know, ROCE is a measure of a company's yearly pre-tax profit (its return), relative to the capital employed in the business. To calculate this metric for ESI Group, this is the formula:
Return on Capital Employed = Earnings Before Interest and Tax (EBIT) ÷ (Total Assets - Current Liabilities)
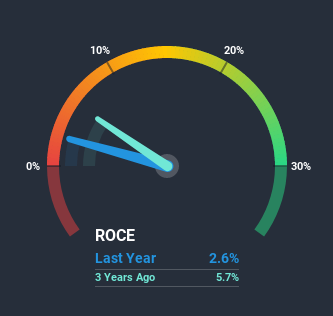
0.026 = €3.9m ÷ (€216m - €65m) (Based on the trailing twelve months to December 2020).
So, ESI Group has an ROCE of 2.6%. Ultimately, that's a low return and it under-performs the Software industry average of 10%.
View our latest analysis for ESI Group
Above you can see how the current ROCE for ESI Group compares to its prior returns on capital, but there's only so much you can tell from the past. If you'd like to see what analysts are forecasting going forward, you should check out our free report for ESI Group.
What Does the ROCE Trend For ESI Group Tell Us?
There is reason to be cautious about ESI Group, given the returns are trending downwards. Unfortunately the returns on capital have diminished from the 7.9% that they were earning five years ago. On top of that, it's worth noting that the amount of capital employed within the business has remained relatively steady. Since returns are falling and the business has the same amount of assets employed, this can suggest it's a mature business that hasn't had much growth in the last five years. If these trends continue, we wouldn't expect ESI Group to turn into a multi-bagger.
The Bottom Line On ESI Group's ROCE
In summary, it's unfortunate that ESI Group is generating lower returns from the same amount of capital. However the stock has delivered a 91% return to shareholders over the last five years, so investors might be expecting the trends to turn around. Regardless, we don't feel too comfortable with the fundamentals so we'd be steering clear of this stock for now.
One more thing, we've spotted 1 warning sign facing ESI Group that you might find interesting.
While ESI Group isn't earning the highest return, check out this free list of companies that are earning high returns on equity with solid balance sheets.
If you decide to trade ESI Group, use the lowest-cost* platform that is rated #1 Overall by Barron’s, Interactive Brokers. Trade stocks, options, futures, forex, bonds and funds on 135 markets, all from a single integrated account. Promoted
Valuation is complex, but we're here to simplify it.
Discover if ESI Group might be undervalued or overvalued with our detailed analysis, featuring fair value estimates, potential risks, dividends, insider trades, and its financial condition.
Access Free AnalysisThis article by Simply Wall St is general in nature. It does not constitute a recommendation to buy or sell any stock, and does not take account of your objectives, or your financial situation. We aim to bring you long-term focused analysis driven by fundamental data. Note that our analysis may not factor in the latest price-sensitive company announcements or qualitative material. Simply Wall St has no position in any stocks mentioned.
*Interactive Brokers Rated Lowest Cost Broker by StockBrokers.com Annual Online Review 2020
Have feedback on this article? Concerned about the content? Get in touch with us directly. Alternatively, email editorial-team (at) simplywallst.com.
About ENXTPA:ESI
ESI Group
ESI Group SA, together with its subsidiaries, designs, develops, and distributes virtual prototyping software solutions in Europe, the Middle East, Africa, the Asia Pacific, and the Americas.
Excellent balance sheet with questionable track record.
Market Insights

Advertisement
Community Narratives
Finding The True Value Of A Logistics Powerhouse
Fair Value US$95.21|8.4% undervalued
NV
Community Contributor
Paradigm Biopharmaceuticals Will Lead Osteoarthritis Treatment with Zilosul's FDA Success
Fair Value AU$5.50|92.1% undervalued
AM
Community Contributor
Barrick Mining (ABX:CA): A Gold Hedge against a U.S. Shutdown
Fair Value CA$60.00|24.2% undervalued
GM
Community Contributor