Take Care Before Jumping Onto The Blockchain Group (EPA:ALTBG) Even Though It's 35% Cheaper

The Blockchain Group (EPA:ALTBG) shares have had a horrible month, losing 35% after a relatively good period beforehand. Instead of being rewarded, shareholders who have already held through the last twelve months are now sitting on a 43% share price drop.
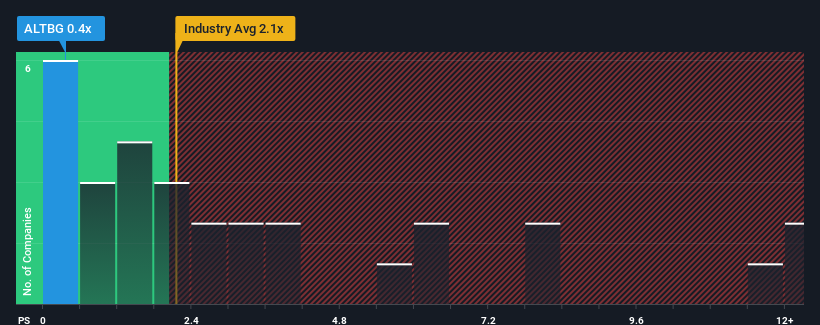
After such a large drop in price, Blockchain Group's price-to-sales (or "P/S") ratio of 0.4x might make it look like a buy right now compared to the Software industry in France, where around half of the companies have P/S ratios above 2.1x and even P/S above 6x are quite common. Although, it's not wise to just take the P/S at face value as there may be an explanation why it's limited.
See our latest analysis for Blockchain Group
How Has Blockchain Group Performed Recently?
For example, consider that Blockchain Group's financial performance has been poor lately as its revenue has been in decline. One possibility is that the P/S is low because investors think the company won't do enough to avoid underperforming the broader industry in the near future. Those who are bullish on Blockchain Group will be hoping that this isn't the case so that they can pick up the stock at a lower valuation.
We don't have analyst forecasts, but you can see how recent trends are setting up the company for the future by checking out our free report on Blockchain Group's earnings, revenue and cash flow.How Is Blockchain Group's Revenue Growth Trending?
There's an inherent assumption that a company should underperform the industry for P/S ratios like Blockchain Group's to be considered reasonable.
Retrospectively, the last year delivered a frustrating 13% decrease to the company's top line. Even so, admirably revenue has lifted 164% in aggregate from three years ago, notwithstanding the last 12 months. Although it's been a bumpy ride, it's still fair to say the revenue growth recently has been more than adequate for the company.
This is in contrast to the rest of the industry, which is expected to grow by 8.8% over the next year, materially lower than the company's recent medium-term annualised growth rates.
With this information, we find it odd that Blockchain Group is trading at a P/S lower than the industry. It looks like most investors are not convinced the company can maintain its recent growth rates.
The Bottom Line On Blockchain Group's P/S
The southerly movements of Blockchain Group's shares means its P/S is now sitting at a pretty low level. We'd say the price-to-sales ratio's power isn't primarily as a valuation instrument but rather to gauge current investor sentiment and future expectations.
We're very surprised to see Blockchain Group currently trading on a much lower than expected P/S since its recent three-year growth is higher than the wider industry forecast. Potential investors that are sceptical over continued revenue performance may be preventing the P/S ratio from matching previous strong performance. At least price risks look to be very low if recent medium-term revenue trends continue, but investors seem to think future revenue could see a lot of volatility.
It is also worth noting that we have found 3 warning signs for Blockchain Group that you need to take into consideration.
It's important to make sure you look for a great company, not just the first idea you come across. So if growing profitability aligns with your idea of a great company, take a peek at this free list of interesting companies with strong recent earnings growth (and a low P/E).
The New Payments ETF Is Live on NASDAQ:
Money is moving to real-time rails, and a newly listed ETF now gives investors direct exposure. Fast settlement. Institutional custody. Simple access.
Explore how this launch could reshape portfolios
Sponsored ContentValuation is complex, but we're here to simplify it.
Discover if Blockchain Group might be undervalued or overvalued with our detailed analysis, featuring fair value estimates, potential risks, dividends, insider trades, and its financial condition.
Access Free AnalysisHave feedback on this article? Concerned about the content? Get in touch with us directly. Alternatively, email editorial-team (at) simplywallst.com.
This article by Simply Wall St is general in nature. We provide commentary based on historical data and analyst forecasts only using an unbiased methodology and our articles are not intended to be financial advice. It does not constitute a recommendation to buy or sell any stock, and does not take account of your objectives, or your financial situation. We aim to bring you long-term focused analysis driven by fundamental data. Note that our analysis may not factor in the latest price-sensitive company announcements or qualitative material. Simply Wall St has no position in any stocks mentioned.
About ENXTPA:ALCPB
Excellent balance sheet with low risk.
Similar Companies
Market Insights

Weekly Picks

Early mover in a fast growing industry. Likely to experience share price volatility as they scale


A case for CA$31.80 (undiluted), aka 8,616% upside from CA$0.37 (an 86 bagger!).


Moderation and Stabilisation: HOLD: Fair Price based on a 4-year Cycle is $12.08
Recently Updated Narratives

Airbnb Stock: Platform Growth in a World of Saturation and Scrutiny

Adobe Stock: AI-Fueled ARR Growth Pushes Guidance Higher, But Cost Pressures Loom

Thomson Reuters Stock: When Legal Intelligence Becomes Mission-Critical Infrastructure
Popular Narratives


Crazy Undervalued 42 Baggers Silver Play (Active & Running Mine)


NVDA: Expanding AI Demand Will Drive Major Data Center Investments Through 2026

The AI Infrastructure Giant Grows Into Its Valuation
Trending Discussion


