- France
- /
- Specialty Stores
- /
- ENXTPA:ALLDL
Groupe LDLC société anonyme (EPA:ALLDL) Stocks Shoot Up 26% But Its P/S Still Looks Reasonable

Those holding Groupe LDLC société anonyme (EPA:ALLDL) shares would be relieved that the share price has rebounded 26% in the last thirty days, but it needs to keep going to repair the recent damage it has caused to investor portfolios. Unfortunately, the gains of the last month did little to right the losses of the last year with the stock still down 33% over that time.
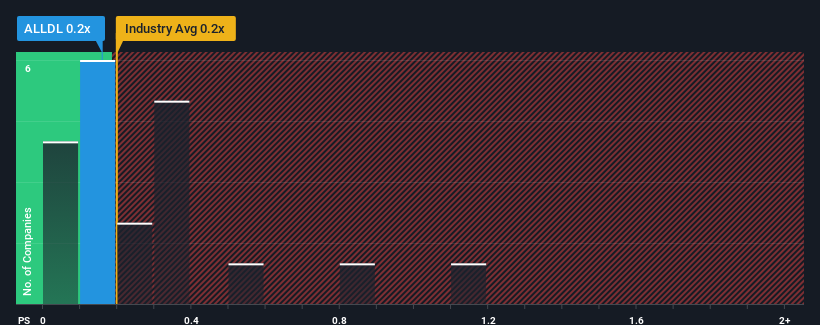
Although its price has surged higher, it's still not a stretch to say that Groupe LDLC société anonyme's price-to-sales (or "P/S") ratio of 0.2x right now seems quite "middle-of-the-road" compared to the Specialty Retail industry in France, seeing as it matches the P/S ratio of the wider industry. While this might not raise any eyebrows, if the P/S ratio is not justified investors could be missing out on a potential opportunity or ignoring looming disappointment.
View our latest analysis for Groupe LDLC société anonyme
What Does Groupe LDLC société anonyme's Recent Performance Look Like?
Groupe LDLC société anonyme's revenue growth of late has been pretty similar to most other companies. Perhaps the market is expecting future revenue performance to show no drastic signs of changing, justifying the P/S being at current levels. If you like the company, you'd be hoping this can at least be maintained so that you could pick up some stock while it's not quite in favour.
Keen to find out how analysts think Groupe LDLC société anonyme's future stacks up against the industry? In that case, our free report is a great place to start.What Are Revenue Growth Metrics Telling Us About The P/S?
In order to justify its P/S ratio, Groupe LDLC société anonyme would need to produce growth that's similar to the industry.
Taking a look back first, we see that there was hardly any revenue growth to speak of for the company over the past year. Whilst it's an improvement, it wasn't enough to get the company out of the hole it was in, with revenue down 21% overall from three years ago. Therefore, it's fair to say the revenue growth recently has been undesirable for the company.
Looking ahead now, revenue is anticipated to climb by 7.3% per year during the coming three years according to the three analysts following the company. Meanwhile, the rest of the industry is forecast to expand by 5.7% per year, which is not materially different.
With this in mind, it makes sense that Groupe LDLC société anonyme's P/S is closely matching its industry peers. It seems most investors are expecting to see average future growth and are only willing to pay a moderate amount for the stock.
What Does Groupe LDLC société anonyme's P/S Mean For Investors?
Its shares have lifted substantially and now Groupe LDLC société anonyme's P/S is back within range of the industry median. Typically, we'd caution against reading too much into price-to-sales ratios when settling on investment decisions, though it can reveal plenty about what other market participants think about the company.
We've seen that Groupe LDLC société anonyme maintains an adequate P/S seeing as its revenue growth figures match the rest of the industry. At this stage investors feel the potential for an improvement or deterioration in revenue isn't great enough to push P/S in a higher or lower direction. Unless these conditions change, they will continue to support the share price at these levels.
We don't want to rain on the parade too much, but we did also find 3 warning signs for Groupe LDLC société anonyme that you need to be mindful of.
If you're unsure about the strength of Groupe LDLC société anonyme's business, why not explore our interactive list of stocks with solid business fundamentals for some other companies you may have missed.
Mobile Infrastructure for Defense and Disaster
The next wave in robotics isn't humanoid. Its fully autonomous towers delivering 5G, ISR, and radar in under 30 minutes, anywhere.
Get the investor briefing before the next round of contracts
Sponsored On Behalf of CiTechNew: Manage All Your Stock Portfolios in One Place
We've created the ultimate portfolio companion for stock investors, and it's free.
• Connect an unlimited number of Portfolios and see your total in one currency
• Be alerted to new Warning Signs or Risks via email or mobile
• Track the Fair Value of your stocks
Have feedback on this article? Concerned about the content? Get in touch with us directly. Alternatively, email editorial-team (at) simplywallst.com.
This article by Simply Wall St is general in nature. We provide commentary based on historical data and analyst forecasts only using an unbiased methodology and our articles are not intended to be financial advice. It does not constitute a recommendation to buy or sell any stock, and does not take account of your objectives, or your financial situation. We aim to bring you long-term focused analysis driven by fundamental data. Note that our analysis may not factor in the latest price-sensitive company announcements or qualitative material. Simply Wall St has no position in any stocks mentioned.
Have feedback on this article? Concerned about the content? Get in touch with us directly. Alternatively, email editorial-team@simplywallst.com
About ENXTPA:ALLDL
Groupe LDLC société anonyme
Operates as an online IT and technology equipment retailer.
Excellent balance sheet and fair value.
Market Insights

Weekly Picks

Early mover in a fast growing industry. Likely to experience share price volatility as they scale


A case for CA$31.80 (undiluted), aka 8,616% upside from CA$0.37 (an 86 bagger!).


Moderation and Stabilisation: HOLD: Fair Price based on a 4-year Cycle is $12.08
Recently Updated Narratives

Airbnb Stock: Platform Growth in a World of Saturation and Scrutiny

Adobe Stock: AI-Fueled ARR Growth Pushes Guidance Higher, But Cost Pressures Loom

Thomson Reuters Stock: When Legal Intelligence Becomes Mission-Critical Infrastructure
Popular Narratives


Crazy Undervalued 42 Baggers Silver Play (Active & Running Mine)


NVDA: Expanding AI Demand Will Drive Major Data Center Investments Through 2026

The AI Infrastructure Giant Grows Into Its Valuation
Trending Discussion


