
Advertisement
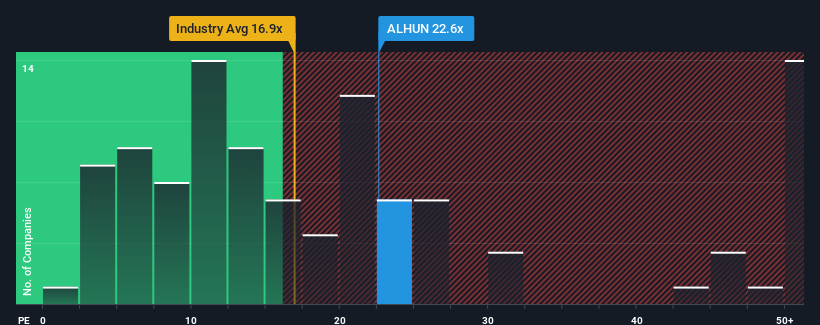
With a price-to-earnings (or "P/E") ratio of 22.6x Hunyvers SA (EPA:ALHUN) may be sending very bearish signals at the moment, given that almost half of all companies in France have P/E ratios under 14x and even P/E's lower than 9x are not unusual. Nonetheless, we'd need to dig a little deeper to determine if there is a rational basis for the highly elevated P/E.
For instance, Hunyvers' receding earnings in recent times would have to be some food for thought. It might be that many expect the company to still outplay most other companies over the coming period, which has kept the P/E from collapsing. If not, then existing shareholders may be quite nervous about the viability of the share price.
See our latest analysis for Hunyvers
Does Growth Match The High P/E?
There's an inherent assumption that a company should far outperform the market for P/E ratios like Hunyvers' to be considered reasonable.
Retrospectively, the last year delivered a frustrating 54% decrease to the company's bottom line. The last three years don't look nice either as the company has shrunk EPS by 47% in aggregate. So unfortunately, we have to acknowledge that the company has not done a great job of growing earnings over that time.
Weighing that medium-term earnings trajectory against the broader market's one-year forecast for expansion of 13% shows it's an unpleasant look.
In light of this, it's alarming that Hunyvers' P/E sits above the majority of other companies. Apparently many investors in the company are way more bullish than recent times would indicate and aren't willing to let go of their stock at any price. Only the boldest would assume these prices are sustainable as a continuation of recent earnings trends is likely to weigh heavily on the share price eventually.
What We Can Learn From Hunyvers' P/E?
It's argued the price-to-earnings ratio is an inferior measure of value within certain industries, but it can be a powerful business sentiment indicator.
We've established that Hunyvers currently trades on a much higher than expected P/E since its recent earnings have been in decline over the medium-term. Right now we are increasingly uncomfortable with the high P/E as this earnings performance is highly unlikely to support such positive sentiment for long. Unless the recent medium-term conditions improve markedly, it's very challenging to accept these prices as being reasonable.
It's always necessary to consider the ever-present spectre of investment risk. We've identified 3 warning signs with Hunyvers (at least 1 which is concerning), and understanding these should be part of your investment process.
It's important to make sure you look for a great company, not just the first idea you come across. So take a peek at this free list of interesting companies with strong recent earnings growth (and a low P/E).
Valuation is complex, but we're here to simplify it.
Discover if Hunyvers might be undervalued or overvalued with our detailed analysis, featuring fair value estimates, potential risks, dividends, insider trades, and its financial condition.
Access Free AnalysisHave feedback on this article? Concerned about the content? Get in touch with us directly. Alternatively, email editorial-team (at) simplywallst.com.
This article by Simply Wall St is general in nature. We provide commentary based on historical data and analyst forecasts only using an unbiased methodology and our articles are not intended to be financial advice. It does not constitute a recommendation to buy or sell any stock, and does not take account of your objectives, or your financial situation. We aim to bring you long-term focused analysis driven by fundamental data. Note that our analysis may not factor in the latest price-sensitive company announcements or qualitative material. Simply Wall St has no position in any stocks mentioned.
About ENXTPA:ALHUN
Hunyvers
Engages in the sale of new and used recreational vehicles of various brands.
Moderate risk with imperfect balance sheet.
Market Insights

Advertisement
Community Narratives
MINISO's fair value is projected at 26.69 with an anticipated PE ratio shift of 20x
Fair Value US$24.03|11.4% undervalued
BE
Community Contributor
Procter & Gamble: A Dividend Giant Facing Slowing Growth
Fair Value US$119.81|23.5% overvalued
AN
Community Contributor
Eli Lilly's Future Growth Driven by Tirzepatide and Favorable Market Conditions
Fair Value US$1.19k|14.0% undervalued
EA
Community Contributor