
Advertisement
- France
- /
- Specialty Stores
- /
- ENXTPA:ALBOU
Bourrelier Group Full Year 2023 Earnings: EPS: €0.57 (vs €1.62 in FY 2022)
Bourrelier Group (EPA:ALBOU) Full Year 2023 Results
Key Financial Results
- Revenue: €294.9m (flat on FY 2022).
- Net income: €3.53m (down 65% from FY 2022).
- Profit margin: 1.2% (down from 3.4% in FY 2022).
- EPS: €0.57 (down from €1.62 in FY 2022).
All figures shown in the chart above are for the trailing 12 month (TTM) period
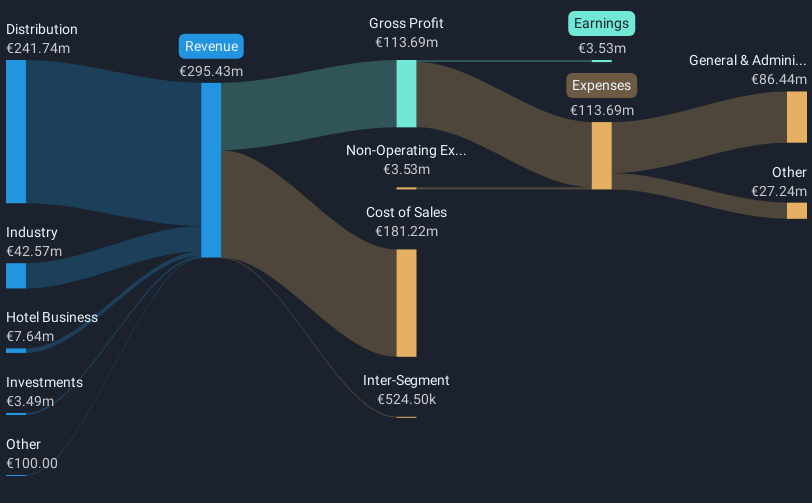
The primary driver behind last 12 months revenue was the Distribution segment contributing a total revenue of €241.7m (82% of total revenue). Notably, cost of sales worth €181.2m amounted to 61% of total revenue thereby underscoring the impact on earnings. The largest operating expense was General & Administrative costs, amounting to €86.4m (76% of total expenses). Over the last 12 months, the company's earnings were enhanced by non-operating gains of €3.53m. Explore how ALBOU's revenue and expenses shape its earnings.
Bourrelier Group's share price is broadly unchanged from a week ago.
Risk Analysis
You should learn about the 4 warning signs we've spotted with Bourrelier Group (including 3 which make us uncomfortable).
Valuation is complex, but we're here to simplify it.
Discover if Bourrelier Group might be undervalued or overvalued with our detailed analysis, featuring fair value estimates, potential risks, dividends, insider trades, and its financial condition.
Access Free AnalysisHave feedback on this article? Concerned about the content? Get in touch with us directly. Alternatively, email editorial-team (at) simplywallst.com.
This article by Simply Wall St is general in nature. We provide commentary based on historical data and analyst forecasts only using an unbiased methodology and our articles are not intended to be financial advice. It does not constitute a recommendation to buy or sell any stock, and does not take account of your objectives, or your financial situation. We aim to bring you long-term focused analysis driven by fundamental data. Note that our analysis may not factor in the latest price-sensitive company announcements or qualitative material. Simply Wall St has no position in any stocks mentioned.
Have feedback on this article? Concerned about the content? Get in touch with us directly. Alternatively, email editorial-team@simplywallst.com
About ENXTPA:ALBOU
Bourrelier Group
Operates do-it-yourself (DIY) stores in France, Belgium, and the Netherlands.
Adequate balance sheet second-rate dividend payer.
Market Insights

Advertisement
Community Narratives
Finding The True Value Of A Logistics Powerhouse
Fair Value US$95.21|8.4% undervalued
NV
Community Contributor
Paradigm Biopharmaceuticals Will Lead Osteoarthritis Treatment with Zilosul's FDA Success
Fair Value AU$5.50|92.1% undervalued
AM
Community Contributor
Barrick Mining (ABX:CA): A Gold Hedge against a U.S. Shutdown
Fair Value CA$60.00|24.2% undervalued
GM
Community Contributor