
Advertisement
Is Ipsen S.A.'s (EPA:IPN) Growth Strong Enough To Justify Its March Share Price?

Ipsen S.A. (EPA:IPN) is a stock well-positioned for future growth, but many investors are wondering whether its last closing price of €119 is based on unrealistic expectations. Let’s look into this by assessing IPN's expected growth over the next few years.
View our latest analysis for Ipsen
What are the future expectations?
Analysts are predicting good growth prospects for Ipsen over the next couple of years. The consensus forecast from 14 analysts is buoyant with earnings per share estimated to surge from current levels of €4.676 to €8.287 over the next three years. On average, this leads to a growth rate of 14% each year, which signals a market-beating outlook in the upcoming years.Is IPN available at a good price after accounting for its growth?
IPN is available at a PE (price-to-earnings) ratio of 25.45x today, which tells us the stock is overvalued based on current earnings compared to the Pharmaceuticals industry average of 24.06x , and overvalued compared to the FR market average ratio of 15.51x .
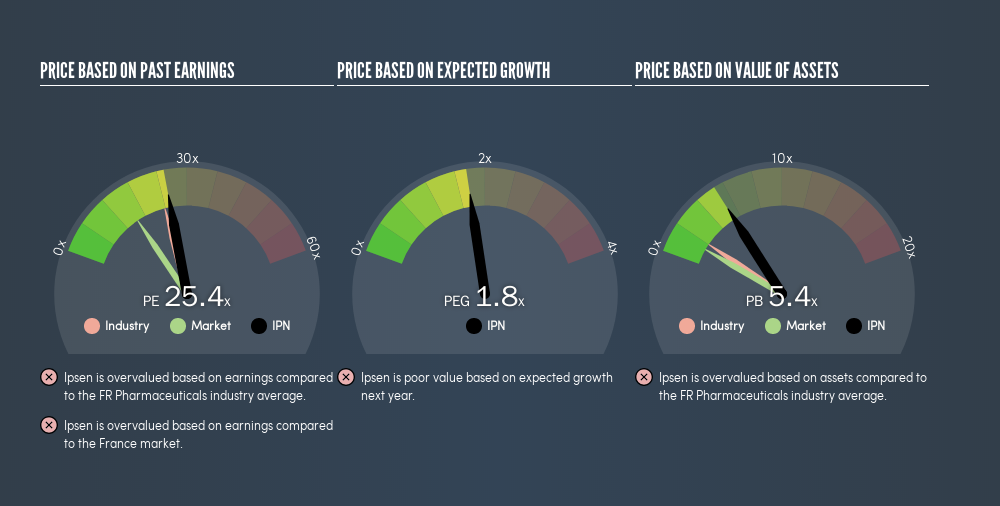
We understand IPN seems to be overvalued based on its current earnings, compared to its industry peers. However, since Ipsen is a high-growth stock, we must also account for its earnings growth by using calculation called the PEG ratio. A PE ratio of 25.45x and expected year-on-year earnings growth of 14% give Ipsen a higher PEG ratio of 1.76x. This tells us that when we include its growth in our analysis Ipsen's stock can be considered a bit overvalued , based on fundamental analysis.
What this means for you:
IPN's current overvaluation could signal a potential selling opportunity to reduce your exposure to the stock, or it you're a potential investor, now may not be the right time to buy. However, basing your investment decision off one metric alone is certainly not sufficient. There are many things I have not taken into account in this article and the PEG ratio is very one-dimensional. If you have not done so already, I highly recommend you to complete your research by taking a look at the following:
- Financial Health: Are IPN’s operations financially sustainable? Balance sheets can be hard to analyze, which is why we’ve done it for you. Check out our financial health checks here.
- Past Track Record: Has IPN been consistently performing well irrespective of the ups and downs in the market? Go into more detail in the past performance analysis and take a look at the free visual representations of IPN's historicals for more clarity.
- Other High-Performing Stocks: Are there other stocks that provide better prospects with proven track records? Explore our free list of these great stocks here.
We aim to bring you long-term focused research analysis driven by fundamental data. Note that our analysis may not factor in the latest price-sensitive company announcements or qualitative material.
If you spot an error that warrants correction, please contact the editor at editorial-team@simplywallst.com. This article by Simply Wall St is general in nature. It does not constitute a recommendation to buy or sell any stock, and does not take account of your objectives, or your financial situation. Simply Wall St has no position in the stocks mentioned. Thank you for reading.
About ENXTPA:IPN
Flawless balance sheet, good value and pays a dividend.
Similar Companies
Market Insights


Advertisement
Community Narratives
MicroStrategy: Volatile Gamble or Golden Opportunity?
Fair Value US$663.00|31.2% undervalued
BL
Community Contributor
Emerging Markets and Debt Reduction Will Propel Bath & Body Works Forward
Fair Value US$40.73|24.4% undervalued
ZW
Community Contributor
An amazing opportunity to potentially get a 100 bagger
Fair Value US$10.00|13.5% overvalued
DA
Community Contributor