Advertisement
- France
- /
- Medical Equipment
- /
- ENXTPA:BIM
Is bioMérieux Still Worth Watching After Recent 8.6% Dip in 2025?

Simply Wall St
Reviewed by Simply Wall St
So, you are considering what’s next for bioMérieux stock and wondering if this is the right moment to act. Maybe you have watched the prices ebb and flow lately, or maybe you are just tuning in. Either way, you are not alone, as investors everywhere are weighing the signals and asking if now is a smart entry, a time to hold, or a reason to steer clear. The stock’s journey has been, to put it mildly, eventful. In the past week, prices slipped by 2.7%, and over the last month, they have dropped 8.6%. Looking a bit further back, however, the story changes: bioMérieux is up 12.1% year-to-date and shows a 35.2% return over three years, though the five-year change still reads as negative, at -6.3%.
Some of this movement can be traced to shifts in market sentiment about diagnostics companies in general, as healthcare investments responded to regulatory changes and evolving global health priorities. While last year’s uncertainty caused some short-term jitters, long-term investors have likely noticed a more balanced narrative emerging.
But what about value? Based on the numbers, the valuation score for bioMérieux sits at 1 out of 6 possible checks for being undervalued. That suggests a mixed verdict, as there might be an opportunity hiding in plain sight, or it could mean recent optimism is already priced in. Let’s break down how we arrive at this score using different valuation approaches, and then explore an even better lens for judging what bioMérieux is really worth.
bioMérieux scores just 1/6 on our valuation checks. See what other red flags we found in the full valuation breakdown.Approach 1: bioMérieux Discounted Cash Flow (DCF) Analysis
A Discounted Cash Flow (DCF) model estimates the value of a business by projecting its future cash flows and then discounting them back to their present value. For bioMérieux, this model starts with a current Free Cash Flow (FCF) of €438 million. Analyst estimates anticipate steady annual growth, projecting FCF to reach about €548 million by 2028. Looking further out, extrapolated figures suggest this could grow to approximately €658 million by 2035. However, estimates past 2028 are less certain and rely on forecast models rather than analyst consensus.
The DCF analysis uses these forecasts to calculate an intrinsic share value of €95.56. When compared to the current share price, this suggests the stock is trading at a premium, with the model indicating it is about 20.4% above its estimated fair value. In other words, based on DCF, bioMérieux appears to be overvalued relative to its long-term cash flow prospects.
Result: OVERVALUED
Head to the Valuation section of our Company Report for more details on how we arrive at this Fair Value for bioMérieux.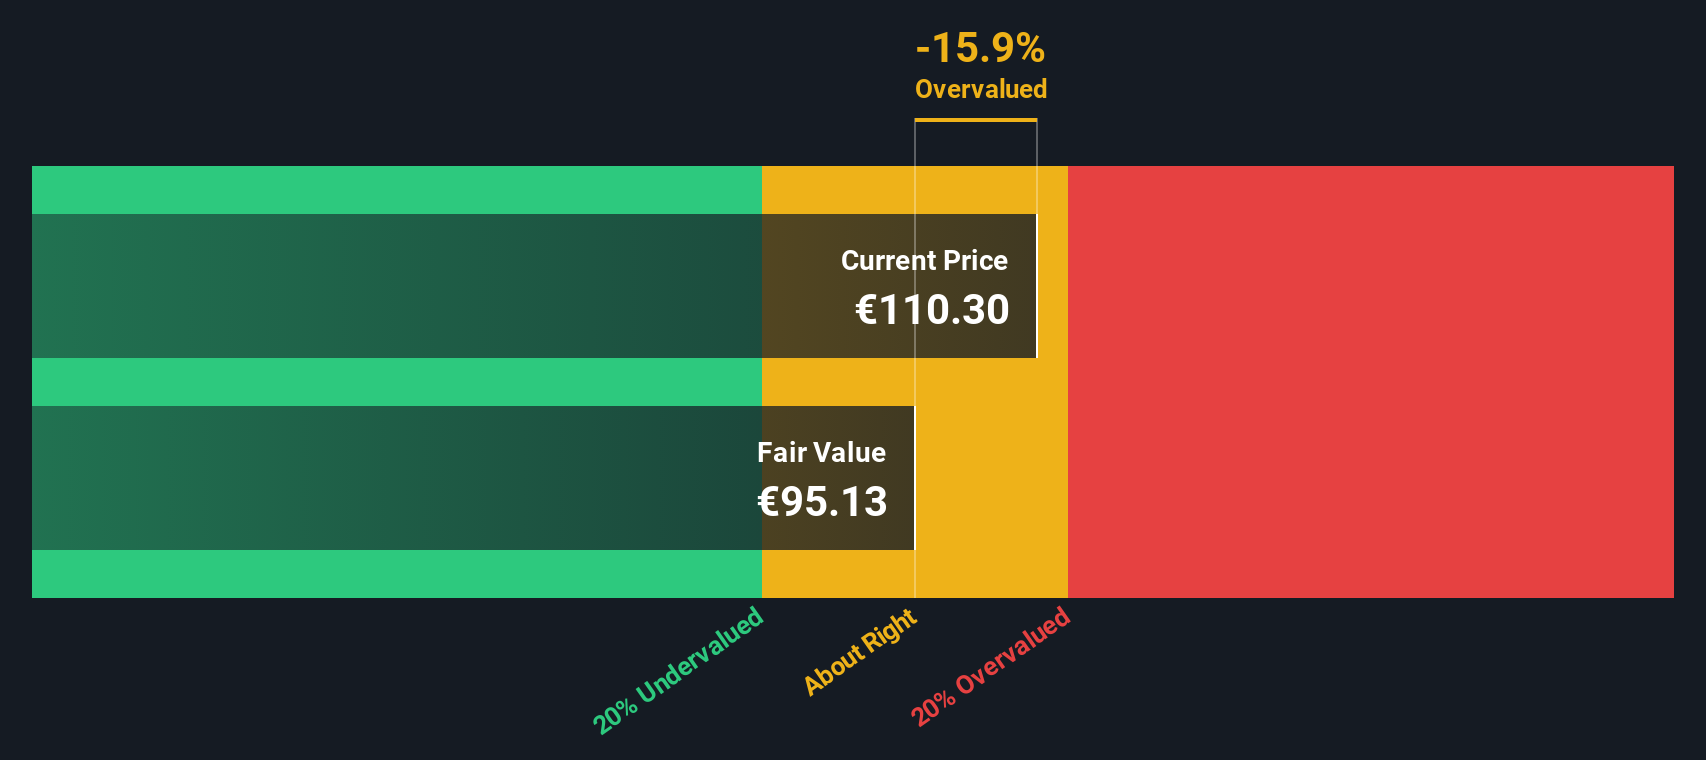
Approach 2: bioMérieux Price vs Earnings
The Price-to-Earnings (PE) ratio is a widely used metric for valuing profitable companies like bioMérieux because it shows how much investors are willing to pay for each euro of earnings. This measure is particularly helpful when a company has healthy, consistent profitability, as it reflects both the company’s current performance and market growth expectations.
Higher growth prospects or reduced risk often justify a "normal" or fair PE ratio that is above the industry average. Conversely, slower expected growth or higher risks typically call for a lower multiple. These dynamics help put a company’s current PE score into context relative to its broader market setting.
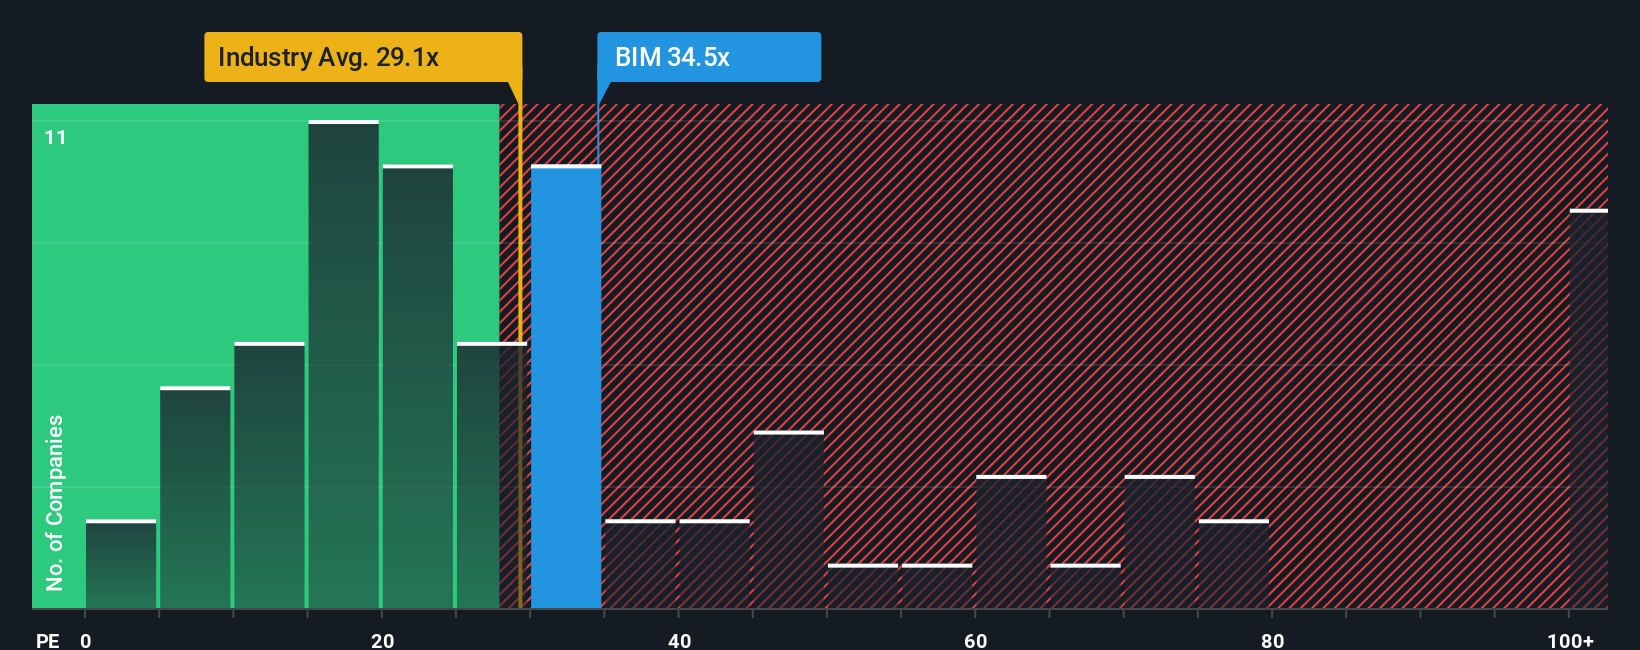
bioMérieux currently trades at a PE of 36x, which is higher than both the Medical Equipment industry average of 28.37x and the sector peer average of 57.21x. To provide a more nuanced perspective, Simply Wall St calculates a “Fair Ratio” for bioMérieux at 25.57x in this case by weighing earnings growth, profit margin, risk, industry sector, and even the company’s market cap. This fair ratio can provide a more accurate reflection of what the stock deserves to trade at, because it looks beyond surface-level comparable companies and benchmarks to incorporate the real drivers that matter to investors.
Comparing bioMérieux’s actual PE of 36x to the Fair Ratio of 25.57x suggests the stock is trading at a sizable premium to its own fundamentals.
Result: OVERVALUED
Upgrade Your Decision Making: Choose your bioMérieux Narrative
Earlier we mentioned that there is an even better way to understand valuation, so let’s introduce you to Narratives. A Narrative goes beyond just the numbers, allowing investors to tell the story they believe about a company, describing why they expect certain growth, profits, or margins, while connecting this back to a financial forecast and an estimated fair value.
On Simply Wall St’s Community page, Narratives are an accessible tool already used by millions worldwide. They help you clarify your thesis, making it easy to see how your expectations (or the market’s) translate into a Fair Value, so you can quickly decide if a stock is under or overvalued compared to today’s price.
Because Narratives update automatically with breaking news or earnings reports, you always have the latest information guiding your thinking. For example, one investor might see bioMérieux’s strong innovation and forecast a fair value as high as €135, while another may be more cautious given industry risks, setting their fair value closer to €90. This illustrates how different perspectives shape real investment decisions.
Do you think there's more to the story for bioMérieux? Create your own Narrative to let the Community know!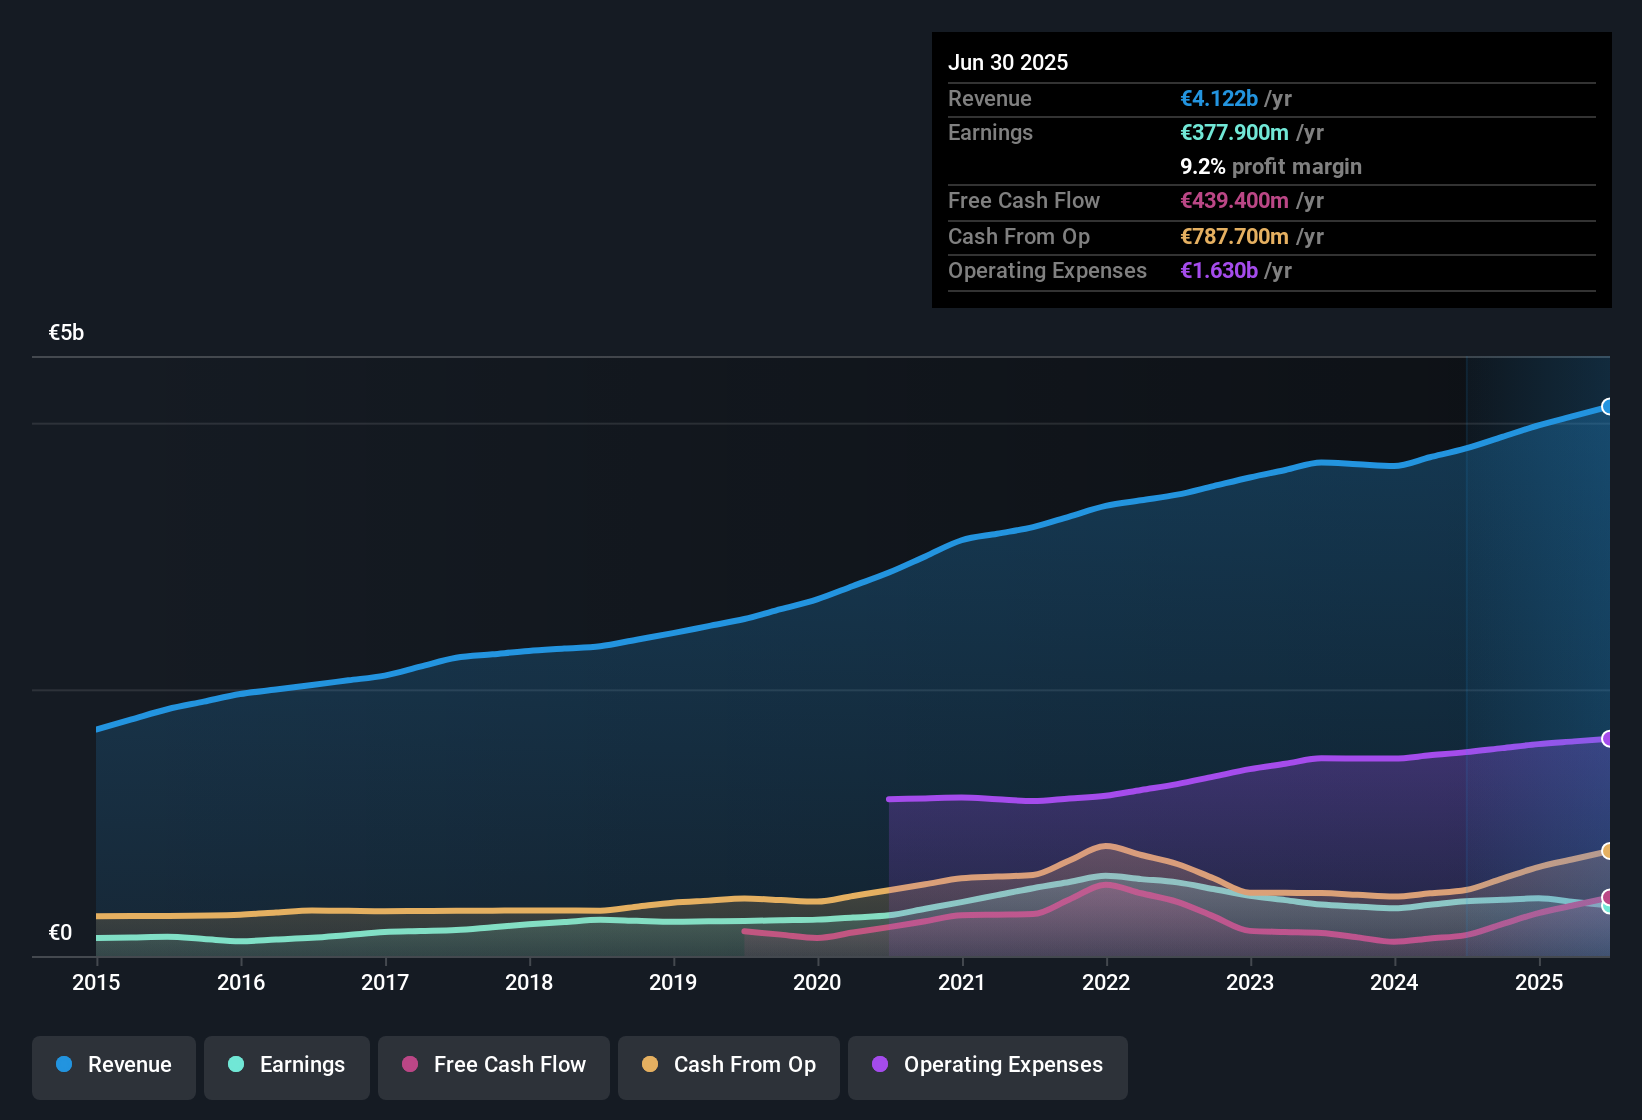
This article by Simply Wall St is general in nature. We provide commentary based on historical data and analyst forecasts only using an unbiased methodology and our articles are not intended to be financial advice. It does not constitute a recommendation to buy or sell any stock, and does not take account of your objectives, or your financial situation. We aim to bring you long-term focused analysis driven by fundamental data. Note that our analysis may not factor in the latest price-sensitive company announcements or qualitative material. Simply Wall St has no position in any stocks mentioned.
New: Manage All Your Stock Portfolios in One Place
We've created the ultimate portfolio companion for stock investors, and it's free.
• Connect an unlimited number of Portfolios and see your total in one currency
• Be alerted to new Warning Signs or Risks via email or mobile
• Track the Fair Value of your stocks
Have feedback on this article? Concerned about the content? Get in touch with us directly. Alternatively, email editorial-team@simplywallst.com
About ENXTPA:BIM
bioMérieux
Develops, manufactures, and markets in vitro diagnostic solutions for infectious diseases in France, Europe, Africa, the Middle East, North and South America, the Asia Pacific, and internationally.
Flawless balance sheet with moderate growth potential.
Similar Companies
Market Insights

Advertisement
Community Narratives
MicroVision will explode future revenue by 380.37% with a vision towards success
Fair Value US$60|98.4% undervalued
TH
Community Contributor
The Indispensable Artery for a New North American Economy
Fair Value CA$132.87|0.6% undervalued
TI
Community Contributor
Recently Updated Narratives
BL


BlackGoat on Alphabet ·
Alphabet: The Under-appreciated Compounder Hiding in Plain Sight
Fair Value:US$324.481.3% undervalued
75 followersusers have followed this narrative
3 commentsusers have commented on this narrative
1 likeusers have liked this narrative
BE


Bejgal on MINISO Group Holding ·
MINISO's fair value is projected at 26.69 with an anticipated PE ratio shift of 20x
Fair Value:US$26.6926.7% undervalued
44 followersusers have followed this narrative
3 commentsusers have commented on this narrative
0 likesusers have liked this narrative
TI


TickerTickle on Oracle ·
The Quiet Giant That Became AI’s Power Grid
Fair Value:US$389.8147.4% undervalued
9 followersusers have followed this narrative
2 commentsusers have commented on this narrative
0 likesusers have liked this narrative
Popular Narratives
OS

oscargarcia on Alphabet ·
The company that turned a verb into a global necessity and basically runs the modern internet, digital ads, smartphones, maps, and AI.
Fair Value:US$3405.9% undervalued
136 followersusers have followed this narrative
6 commentsusers have commented on this narrative
18 likesusers have liked this narrative
TH

TheWallstreetKing on MicroVision ·
MicroVision will explode future revenue by 380.37% with a vision towards success
Fair Value:US$6098.4% undervalued
89 followersusers have followed this narrative
11 commentsusers have commented on this narrative
18 likesusers have liked this narrative
AN


AnalystConsensusTarget on NVIDIA ·
NVDA: Expanding AI Demand Will Drive Major Data Center Investments Through 2026
Fair Value:US$232.7922.6% undervalued
926 followersusers have followed this narrative
6 commentsusers have commented on this narrative
22 likesusers have liked this narrative