
Advertisement
There are a few key trends to look for if we want to identify the next multi-bagger. Typically, we'll want to notice a trend of growing return on capital employed (ROCE) and alongside that, an expanding base of capital employed. Put simply, these types of businesses are compounding machines, meaning they are continually reinvesting their earnings at ever-higher rates of return. So, when we ran our eye over SEB's (EPA:SK) trend of ROCE, we liked what we saw.
Understanding Return On Capital Employed (ROCE)
If you haven't worked with ROCE before, it measures the 'return' (pre-tax profit) a company generates from capital employed in its business. To calculate this metric for SEB, this is the formula:
Return on Capital Employed = Earnings Before Interest and Tax (EBIT) ÷ (Total Assets - Current Liabilities)
0.12 = €695m ÷ (€9.3b - €3.4b) (Based on the trailing twelve months to December 2023).
Thus, SEB has an ROCE of 12%. That's a pretty standard return and it's in line with the industry average of 12%.
Check out our latest analysis for SEB
In the above chart we have measured SEB's prior ROCE against its prior performance, but the future is arguably more important. If you're interested, you can view the analysts predictions in our free analyst report for SEB .
What The Trend Of ROCE Can Tell Us
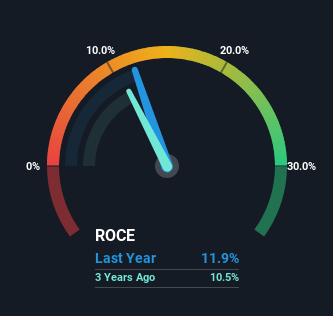
While the current returns on capital are decent, they haven't changed much. The company has employed 22% more capital in the last five years, and the returns on that capital have remained stable at 12%. Since 12% is a moderate ROCE though, it's good to see a business can continue to reinvest at these decent rates of return. Stable returns in this ballpark can be unexciting, but if they can be maintained over the long run, they often provide nice rewards to shareholders.
What We Can Learn From SEB's ROCE
The main thing to remember is that SEB has proven its ability to continually reinvest at respectable rates of return. Yet over the last five years the stock has declined 12%, so the decline might provide an opening. For that reason, savvy investors might want to look further into this company in case it's a prime investment.
Like most companies, SEB does come with some risks, and we've found 2 warning signs that you should be aware of.
For those who like to invest in solid companies, check out this free list of companies with solid balance sheets and high returns on equity.
New: Manage All Your Stock Portfolios in One Place
We've created the ultimate portfolio companion for stock investors, and it's free.
• Connect an unlimited number of Portfolios and see your total in one currency
• Be alerted to new Warning Signs or Risks via email or mobile
• Track the Fair Value of your stocks
Have feedback on this article? Concerned about the content? Get in touch with us directly. Alternatively, email editorial-team (at) simplywallst.com.
This article by Simply Wall St is general in nature. We provide commentary based on historical data and analyst forecasts only using an unbiased methodology and our articles are not intended to be financial advice. It does not constitute a recommendation to buy or sell any stock, and does not take account of your objectives, or your financial situation. We aim to bring you long-term focused analysis driven by fundamental data. Note that our analysis may not factor in the latest price-sensitive company announcements or qualitative material. Simply Wall St has no position in any stocks mentioned.
About ENXTPA:SK
SEB
Designs, manufactures, and markets small domestic equipment in Western Europe, rest of Europe, the Middle East, Africa, North and South America, China, and rest of Asia.
Moderate risk with adequate balance sheet.
Similar Companies
Market Insights

Advertisement
Community Narratives
MINISO's fair value is projected at 26.69 with an anticipated PE ratio shift of 20x
Fair Value US$24.03|11.0% undervalued
BE
Community Contributor
Procter & Gamble: A Dividend Giant Facing Slowing Growth
Fair Value US$119.81|23.3% overvalued
AN
Community Contributor
Eli Lilly's Future Growth Driven by Tirzepatide and Favorable Market Conditions
Fair Value US$1.19k|13.8% undervalued
EA
Community Contributor