
Advertisement

Key Insights
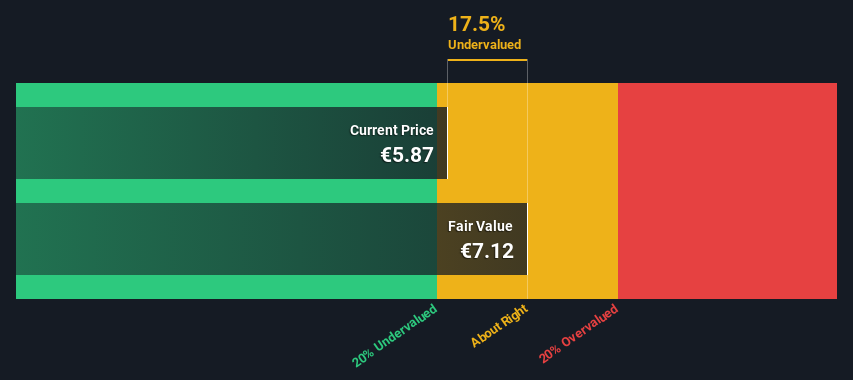
- The projected fair value for SA Catana Group is €7.12 based on 2 Stage Free Cash Flow to Equity
- SA Catana Group's €5.87 share price indicates it is trading at similar levels as its fair value estimate
Today we will run through one way of estimating the intrinsic value of SA Catana Group (EPA:CATG) by projecting its future cash flows and then discounting them to today's value. We will take advantage of the Discounted Cash Flow (DCF) model for this purpose. Before you think you won't be able to understand it, just read on! It's actually much less complex than you'd imagine.
Companies can be valued in a lot of ways, so we would point out that a DCF is not perfect for every situation. If you want to learn more about discounted cash flow, the rationale behind this calculation can be read in detail in the Simply Wall St analysis model.
View our latest analysis for SA Catana Group
The Calculation
We use what is known as a 2-stage model, which simply means we have two different periods of growth rates for the company's cash flows. Generally the first stage is higher growth, and the second stage is a lower growth phase. To begin with, we have to get estimates of the next ten years of cash flows. Where possible we use analyst estimates, but when these aren't available we extrapolate the previous free cash flow (FCF) from the last estimate or reported value. We assume companies with shrinking free cash flow will slow their rate of shrinkage, and that companies with growing free cash flow will see their growth rate slow, over this period. We do this to reflect that growth tends to slow more in the early years than it does in later years.
A DCF is all about the idea that a dollar in the future is less valuable than a dollar today, and so the sum of these future cash flows is then discounted to today's value:
10-year free cash flow (FCF) estimate
| 2024 | 2025 | 2026 | 2027 | 2028 | 2029 | 2030 | 2031 | 2032 | 2033 | |
| Levered FCF (€, Millions) | €23.1m | €19.5m | €17.4m | €16.1m | €15.4m | €14.9m | €14.6m | €14.4m | €14.4m | €14.4m |
| Growth Rate Estimate Source | Analyst x1 | Est @ -15.65% | Est @ -10.70% | Est @ -7.23% | Est @ -4.80% | Est @ -3.10% | Est @ -1.91% | Est @ -1.08% | Est @ -0.50% | Est @ -0.09% |
| Present Value (€, Millions) Discounted @ 7.6% | €21.5 | €16.8 | €14.0 | €12.0 | €10.6 | €9.6 | €8.7 | €8.0 | €7.4 | €6.9 |
("Est" = FCF growth rate estimated by Simply Wall St)
Present Value of 10-year Cash Flow (PVCF) = €116m
The second stage is also known as Terminal Value, this is the business's cash flow after the first stage. The Gordon Growth formula is used to calculate Terminal Value at a future annual growth rate equal to the 5-year average of the 10-year government bond yield of 0.9%. We discount the terminal cash flows to today's value at a cost of equity of 7.6%.
Terminal Value (TV)= FCF2033 × (1 + g) ÷ (r – g) = €14m× (1 + 0.9%) ÷ (7.6%– 0.9%) = €214m
Present Value of Terminal Value (PVTV)= TV / (1 + r)10= €214m÷ ( 1 + 7.6%)10= €103m
The total value, or equity value, is then the sum of the present value of the future cash flows, which in this case is €218m. The last step is to then divide the equity value by the number of shares outstanding. Compared to the current share price of €5.9, the company appears about fair value at a 18% discount to where the stock price trades currently. The assumptions in any calculation have a big impact on the valuation, so it is better to view this as a rough estimate, not precise down to the last cent.
The Assumptions
The calculation above is very dependent on two assumptions. The first is the discount rate and the other is the cash flows. Part of investing is coming up with your own evaluation of a company's future performance, so try the calculation yourself and check your own assumptions. The DCF also does not consider the possible cyclicality of an industry, or a company's future capital requirements, so it does not give a full picture of a company's potential performance. Given that we are looking at SA Catana Group as potential shareholders, the cost of equity is used as the discount rate, rather than the cost of capital (or weighted average cost of capital, WACC) which accounts for debt. In this calculation we've used 7.6%, which is based on a levered beta of 1.175. Beta is a measure of a stock's volatility, compared to the market as a whole. We get our beta from the industry average beta of globally comparable companies, with an imposed limit between 0.8 and 2.0, which is a reasonable range for a stable business.
SWOT Analysis for SA Catana Group
Strength
- Debt is not viewed as a risk.
Weakness
- Earnings growth over the past year underperformed the Leisure industry.
- Dividend is low compared to the top 25% of dividend payers in the Leisure market.
Opportunity
- Annual earnings are forecast to grow faster than the French market.
- Good value based on P/E ratio and estimated fair value.
Threat
- No apparent threats visible for CATG.
Moving On:
Whilst important, the DCF calculation shouldn't be the only metric you look at when researching a company. It's not possible to obtain a foolproof valuation with a DCF model. Rather it should be seen as a guide to "what assumptions need to be true for this stock to be under/overvalued?" If a company grows at a different rate, or if its cost of equity or risk free rate changes sharply, the output can look very different. For SA Catana Group, we've compiled three pertinent factors you should explore:
- Risks: To that end, you should learn about the 2 warning signs we've spotted with SA Catana Group (including 1 which is a bit concerning) .
- Future Earnings: How does CATG's growth rate compare to its peers and the wider market? Dig deeper into the analyst consensus number for the upcoming years by interacting with our free analyst growth expectation chart.
- Other Solid Businesses: Low debt, high returns on equity and good past performance are fundamental to a strong business. Why not explore our interactive list of stocks with solid business fundamentals to see if there are other companies you may not have considered!
PS. The Simply Wall St app conducts a discounted cash flow valuation for every stock on the ENXTPA every day. If you want to find the calculation for other stocks just search here.
New: Manage All Your Stock Portfolios in One Place
We've created the ultimate portfolio companion for stock investors, and it's free.
• Connect an unlimited number of Portfolios and see your total in one currency
• Be alerted to new Warning Signs or Risks via email or mobile
• Track the Fair Value of your stocks
Have feedback on this article? Concerned about the content? Get in touch with us directly. Alternatively, email editorial-team (at) simplywallst.com.
This article by Simply Wall St is general in nature. We provide commentary based on historical data and analyst forecasts only using an unbiased methodology and our articles are not intended to be financial advice. It does not constitute a recommendation to buy or sell any stock, and does not take account of your objectives, or your financial situation. We aim to bring you long-term focused analysis driven by fundamental data. Note that our analysis may not factor in the latest price-sensitive company announcements or qualitative material. Simply Wall St has no position in any stocks mentioned.
About ENXTPA:ALCAT
SA Catana Group
Manufactures and catamarans and related services in France and internationally.
Good value with adequate balance sheet.
Market Insights


Advertisement
Community Narratives
Alphabet: The Under-appreciated Compounder Hiding in Plain Sight
Fair Value US$268.43|26.8% undervalued
BL
Community Contributor
Planet Labs: At The Heart Of The Emerging New Space Boom
Fair Value US$11.31|45.3% undervalued
AN
Community Contributor
Exxon in Guyana 5 year forecast Low $135 to High $189
Fair Value US$189.00|40.3% undervalued
AG
Community Contributor