
Advertisement
- France
- /
- Professional Services
- /
- ENXTPA:ALGEC
There's Reason For Concern Over GECI International S.A.'s (EPA:ALGEC) Massive 80% Price Jump

Despite an already strong run, GECI International S.A. (EPA:ALGEC) shares have been powering on, with a gain of 80% in the last thirty days. But the last month did very little to improve the 66% share price decline over the last year.
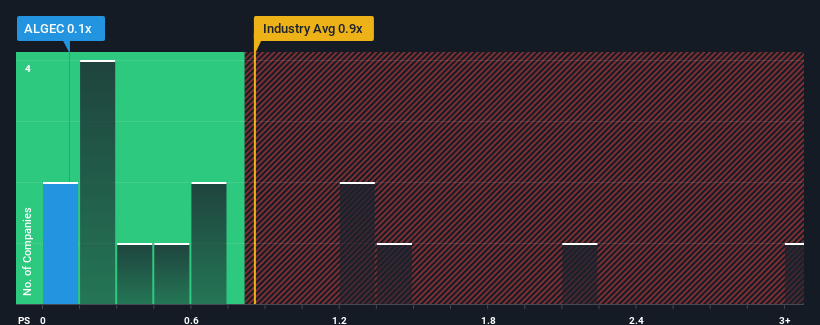
Although its price has surged higher, it's still not a stretch to say that GECI International's price-to-sales (or "P/S") ratio of 0.1x right now seems quite "middle-of-the-road" compared to the Professional Services industry in France, where the median P/S ratio is around 0.5x. Although, it's not wise to simply ignore the P/S without explanation as investors may be disregarding a distinct opportunity or a costly mistake.
View our latest analysis for GECI International
What Does GECI International's Recent Performance Look Like?
Revenue has risen firmly for GECI International recently, which is pleasing to see. It might be that many expect the respectable revenue performance to wane, which has kept the P/S from rising. If that doesn't eventuate, then existing shareholders probably aren't too pessimistic about the future direction of the share price.
We don't have analyst forecasts, but you can see how recent trends are setting up the company for the future by checking out our free report on GECI International's earnings, revenue and cash flow.How Is GECI International's Revenue Growth Trending?
There's an inherent assumption that a company should be matching the industry for P/S ratios like GECI International's to be considered reasonable.
If we review the last year of revenue growth, the company posted a worthy increase of 13%. The latest three year period has also seen a 6.6% overall rise in revenue, aided somewhat by its short-term performance. Accordingly, shareholders would have probably been satisfied with the medium-term rates of revenue growth.
This is in contrast to the rest of the industry, which is expected to grow by 11% over the next year, materially higher than the company's recent medium-term annualised growth rates.
With this information, we find it interesting that GECI International is trading at a fairly similar P/S compared to the industry. Apparently many investors in the company are less bearish than recent times would indicate and aren't willing to let go of their stock right now. Maintaining these prices will be difficult to achieve as a continuation of recent revenue trends is likely to weigh down the shares eventually.
The Bottom Line On GECI International's P/S
GECI International appears to be back in favour with a solid price jump bringing its P/S back in line with other companies in the industry While the price-to-sales ratio shouldn't be the defining factor in whether you buy a stock or not, it's quite a capable barometer of revenue expectations.
Our examination of GECI International revealed its poor three-year revenue trends aren't resulting in a lower P/S as per our expectations, given they look worse than current industry outlook. When we see weak revenue with slower than industry growth, we suspect the share price is at risk of declining, bringing the P/S back in line with expectations. If recent medium-term revenue trends continue, the probability of a share price decline will become quite substantial, placing shareholders at risk.
You always need to take note of risks, for example - GECI International has 3 warning signs we think you should be aware of.
If you're unsure about the strength of GECI International's business, why not explore our interactive list of stocks with solid business fundamentals for some other companies you may have missed.
New: Manage All Your Stock Portfolios in One Place
We've created the ultimate portfolio companion for stock investors, and it's free.
• Connect an unlimited number of Portfolios and see your total in one currency
• Be alerted to new Warning Signs or Risks via email or mobile
• Track the Fair Value of your stocks
Have feedback on this article? Concerned about the content? Get in touch with us directly. Alternatively, email editorial-team (at) simplywallst.com.
This article by Simply Wall St is general in nature. We provide commentary based on historical data and analyst forecasts only using an unbiased methodology and our articles are not intended to be financial advice. It does not constitute a recommendation to buy or sell any stock, and does not take account of your objectives, or your financial situation. We aim to bring you long-term focused analysis driven by fundamental data. Note that our analysis may not factor in the latest price-sensitive company announcements or qualitative material. Simply Wall St has no position in any stocks mentioned.
About ENXTPA:ALGEC
GECI International
Provides digital solutions and technology consulting services in France and Brazil.
Good value with adequate balance sheet.
Market Insights


Advertisement
Community Narratives
Alphabet: The Under-appreciated Compounder Hiding in Plain Sight
Fair Value US$282.83|30.5% undervalued
BL
Community Contributor
Planet Labs: At The Heart Of The Emerging New Space Boom
Fair Value US$11.31|45.3% undervalued
AN
Community Contributor
Exxon in Guyana 5 year forecast Low $135 to High $189
Fair Value US$189.00|40.3% undervalued
AG
Community Contributor