Advertisement
- France
- /
- Electrical
- /
- ENXTPA:SU
Is There Still Upside in Schneider Electric After Shares Jumped 9% This Month?

Simply Wall St
Reviewed by Bailey Pemberton
Thinking of making a move with Schneider Electric stock? You're not alone. Whether you're a seasoned investor or just someone eyeing the latest buzz, the stock's journey has certainly caught the attention of markets this year. In the past month alone, shares have jumped 9.1%, and that follows a strong 3.1% gain just in the last week. If you zoom out further, the returns get even more impressive: 105.3% over three years and a remarkable 167.7% in five years. This performance naturally gets people asking what is driving the action, and whether there is still value left in the tank.
Some of the momentum can be traced back to Schneider Electric’s strategic moves in sustainability and energy management, as well as a wave of investments in greener technologies. Investors have responded positively to these developments, seeing the company as well-positioned for the future. However, when Schneider Electric is examined from a valuation perspective, things get interesting. According to our scorecard, the company is currently undervalued in just 1 out of 6 key valuation checks, which suggests the stock might be priced more in line with its solid track record and future potential than some recent gains might imply.
So, how does the current valuation really stack up, and could there still be upside hiding in plain sight? Up next, we will break down Schneider Electric’s worth using several tried-and-true valuation approaches. Stay tuned until the end, as we also explore a more nuanced way to truly assess what the stock could be worth beyond what the numbers alone tell us.
Schneider Electric scores just 1/6 on our valuation checks. See what other red flags we found in the full valuation breakdown.
Approach 1: Schneider Electric Discounted Cash Flow (DCF) Analysis
The Discounted Cash Flow (DCF) model works by estimating a company's future cash flows and then discounting those projections back to today's value. This provides insight into what the business may truly be worth at present, rather than relying solely on recent stock price trends.
For Schneider Electric, the current Free Cash Flow (FCF) stands at approximately €3.8 billion. According to analysts, this figure is forecast to grow, reaching about €5.8 billion by 2029. After that, additional growth estimates are extrapolated, showing modest expansion through 2035, with free cash flows steadily climbing based on anticipated performance and economic factors. All cash flows are reported in euros (€).
Once these future cash flows are projected and discounted to their present value, the DCF model calculates an intrinsic value of €144.08 per share. When compared to the company's current market price, the analysis indicates that Schneider Electric stock is approximately 76% overvalued according to DCF methodology.
Result: OVERVALUED
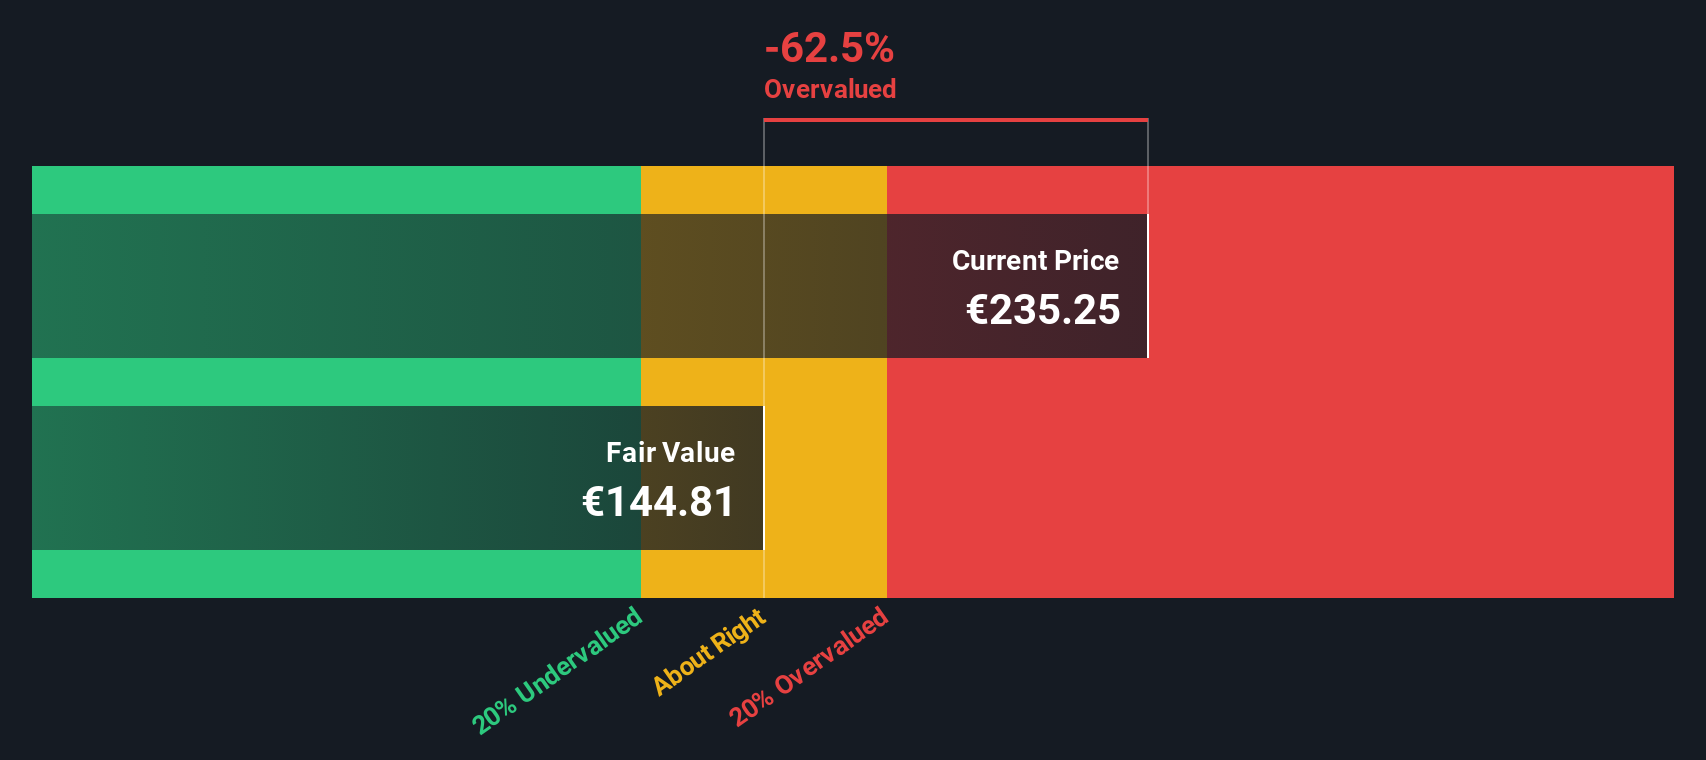
Our Discounted Cash Flow (DCF) analysis suggests Schneider Electric may be overvalued by 76.0%. Find undervalued stocks or create your own screener to find better value opportunities.
Approach 2: Schneider Electric Price vs Earnings (PE) Multiple
For companies like Schneider Electric, which are profitable and have established earnings, the Price-to-Earnings (PE) ratio is a widely used valuation metric. The PE ratio helps investors gauge how much they are paying for each unit of a company’s earnings and is especially useful when comparing businesses in the same sector.
What makes a PE ratio "fair" depends on factors such as the company’s expected growth, perceived risks, and how it compares to industry peers. Generally, higher growth and lower risk can justify a higher PE, while slower growth or greater uncertainty tend to warrant a lower ratio.
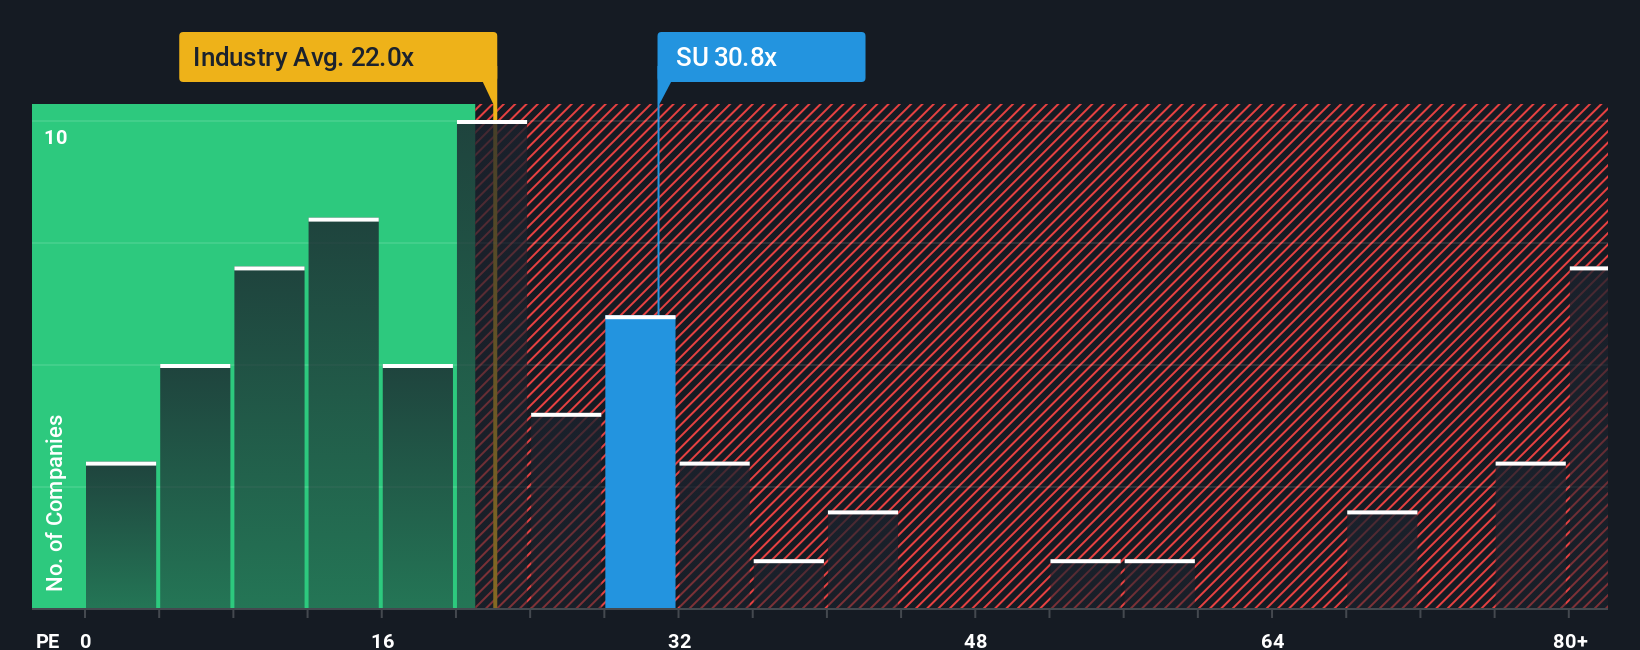
Schneider Electric currently trades at a PE ratio of 33.2x. This is slightly above the Electrical industry average of 31.5x and well above the average for its peers at 26.4x. However, Simply Wall St’s proprietary "Fair Ratio" for the company, calculated by weighing elements like earnings growth, profit margins, industry dynamics, and market capitalization, comes in at 34.4x.
The Fair Ratio gives a more holistic perspective than a simple peer or industry comparison because it adapts to a company’s unique strengths and risks, and is tailored to Schneider Electric's financial profile. When we stack up Schneider Electric’s current PE (33.2x) against its Fair Ratio (34.4x), the difference is less than 0.10, signaling that the shares are priced about right given their underlying fundamentals.
Result: ABOUT RIGHT
PE ratios tell one story, but what if the real opportunity lies elsewhere? Discover companies where insiders are betting big on explosive growth.
Upgrade Your Decision Making: Choose your Schneider Electric Narrative
Earlier we mentioned that there is an even better way to understand valuation, so let's introduce you to Narratives. A Narrative is simply your story or perspective on a company, putting context and conviction behind the numbers by outlining what you believe Schneider Electric will achieve in the future, including expected revenue, earnings, margins, and fair value.
With Narratives, you are not just crunching numbers; you are linking the company’s real-world story to a financial forecast and then arriving at a fair value based on what you actually believe will happen. Narratives are available to everyone on Simply Wall St’s Community page, where millions of investors can easily create or explore Narratives for any stock, including Schneider Electric.
By using Narratives, you can quickly see how your forecasted fair value compares to the current price, helping you decide if it is time to buy, hold, or sell. In addition, Narratives dynamically update when new information such as earnings reports or news arrives, so your analysis stays current.
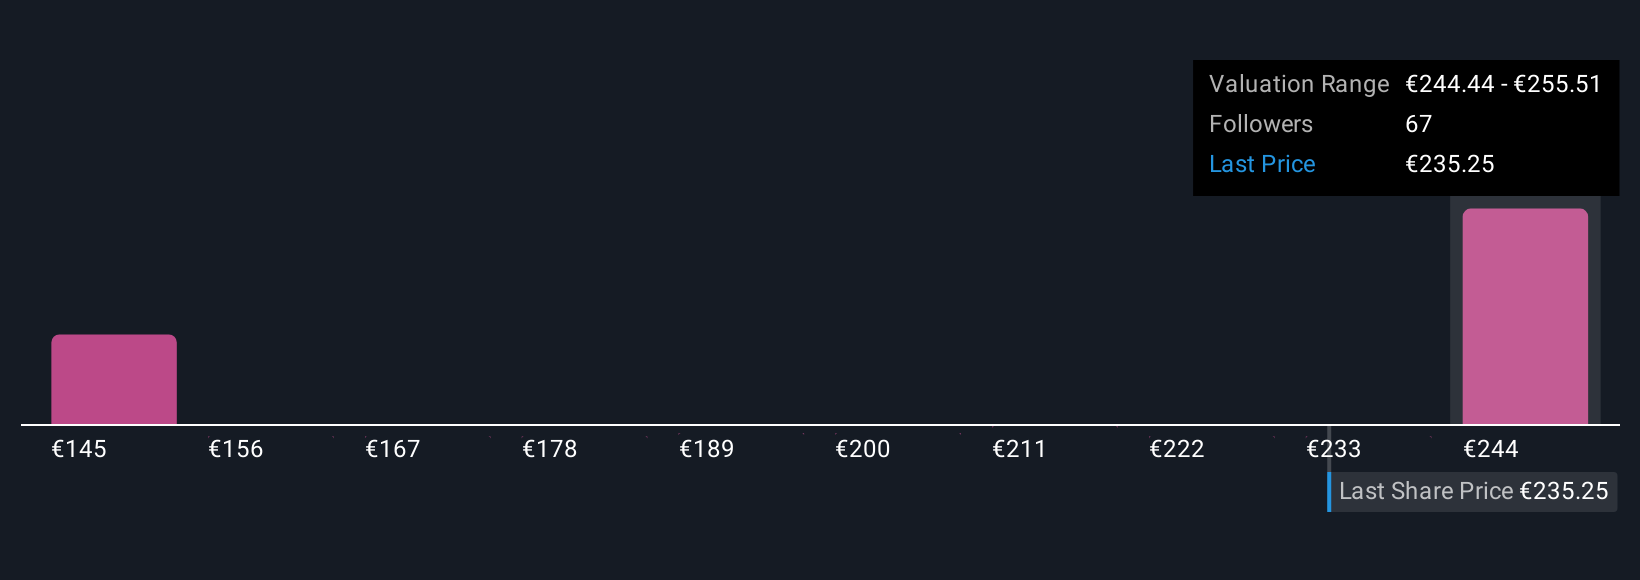
For example, some Schneider Electric Narratives on the platform forecast a robust price target of €289, while others cite more cautious assumptions and land at €220. This shows how your unique viewpoint can guide smarter, faster investing decisions.
Do you think there's more to the story for Schneider Electric? Create your own Narrative to let the Community know!
This article by Simply Wall St is general in nature. We provide commentary based on historical data and analyst forecasts only using an unbiased methodology and our articles are not intended to be financial advice. It does not constitute a recommendation to buy or sell any stock, and does not take account of your objectives, or your financial situation. We aim to bring you long-term focused analysis driven by fundamental data. Note that our analysis may not factor in the latest price-sensitive company announcements or qualitative material. Simply Wall St has no position in any stocks mentioned.
New: Manage All Your Stock Portfolios in One Place
We've created the ultimate portfolio companion for stock investors, and it's free.
• Connect an unlimited number of Portfolios and see your total in one currency
• Be alerted to new Warning Signs or Risks via email or mobile
• Track the Fair Value of your stocks
Have feedback on this article? Concerned about the content? Get in touch with us directly. Alternatively, email editorial-team@simplywallst.com
About ENXTPA:SU
Schneider Electric
Engages in the energy management and industrial automation businesses worldwide.
Proven track record with adequate balance sheet and pays a dividend.
Similar Companies
Market Insights

Advertisement
Community Narratives
Finding The True Value Of A Logistics Powerhouse
Fair Value US$95.21|8.4% undervalued
NV
Community Contributor
Paradigm Biopharmaceuticals Will Lead Osteoarthritis Treatment with Zilosul's FDA Success
Fair Value AU$5.50|92.1% undervalued
AM
Community Contributor
Barrick Mining (ABX:CA): A Gold Hedge against a U.S. Shutdown
Fair Value CA$60.00|24.2% undervalued
GM
Community Contributor