Advertisement
- France
- /
- Aerospace & Defense
- /
- ENXTPA:AIR
Is Airbus Attractively Priced After 53.5% Rally and New Aircraft Orders?

Simply Wall St
Reviewed by Bailey Pemberton
- Wondering if Airbus is actually a bargain right now? You’re not alone, and a closer look at its value could offer some surprises for investors weighing their next move.
- The stock has seen a stellar run lately, rising 2.5% over the past week and booking an impressive 53.5% return over the last year, hinting at accelerating growth and perhaps a shift in how the market views its prospects.
- Big headlines haven’t been in short supply, with supply chain improvements and new aircraft orders grabbing industry attention. These updates have helped fuel bullish sentiment and could explain some of the recent stock price momentum.
- When it comes to valuation, Airbus currently scores a 5 out of 6 on our value checks, suggesting strong undervaluation signals. Next, we’ll dig into the details behind this score using different valuation methods, and at the end, reveal a smarter way to think about what the stock might be worth.
Find out why Airbus's 53.5% return over the last year is lagging behind its peers.
Approach 1: Airbus Discounted Cash Flow (DCF) Analysis
The Discounted Cash Flow (DCF) model estimates a company's value by projecting its future cash flows and discounting them back to today, providing a present value based on expected performance. For Airbus, this analysis uses a two-stage free cash flow to equity method.
Currently, Airbus generates €3.81 billion in free cash flow. Analyst estimates, available through 2029, see this figure rising steadily year after year. For example, by 2029, Airbus’s free cash flow is projected to reach €9.45 billion. Beyond that, projections are extrapolated, but confidence is higher in the nearer-term analyst consensus, which is both robust and optimistic about Airbus's outlook.
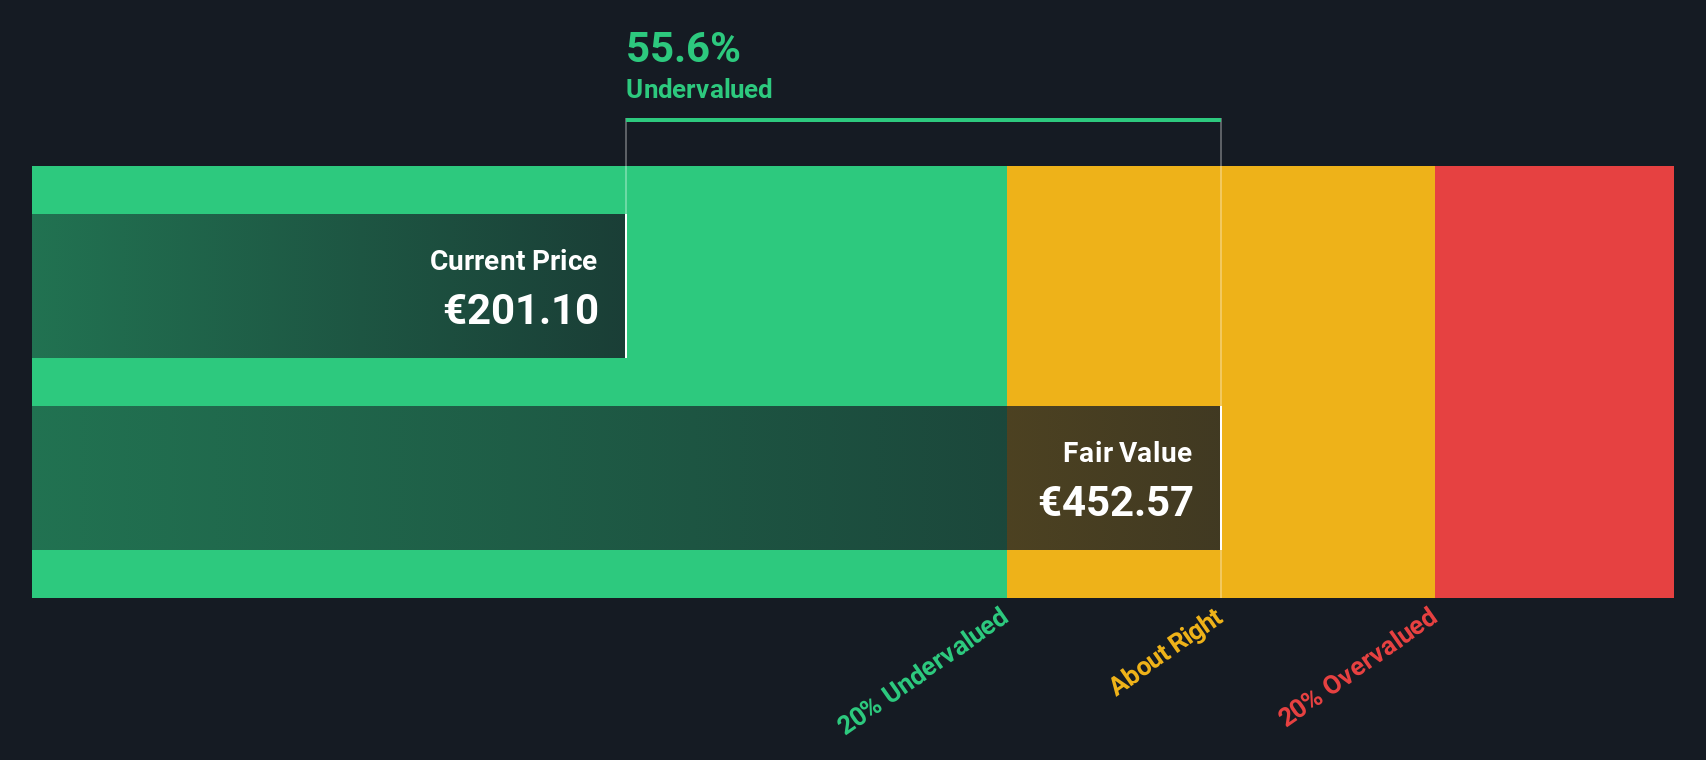
Taking these forecasted cash flows and discounting them, the DCF approach arrives at an estimated intrinsic value of €329.68 per share. Compared to recent share prices, this suggests Airbus is trading at a 35.4% discount. This indicates it is viewed as significantly undervalued by this methodology.
Result: UNDERVALUED
Our Discounted Cash Flow (DCF) analysis suggests Airbus is undervalued by 35.4%. Track this in your watchlist or portfolio, or discover 843 more undervalued stocks based on cash flows.
Approach 2: Airbus Price vs Earnings (PE) Ratio Analysis
The Price-to-Earnings (PE) ratio is a popular valuation metric for profitable companies like Airbus because it relates a company's share price to its earnings, making it a direct way to assess what investors are willing to pay today for future profits. For businesses with positive and stable earnings, the PE ratio serves as a quick pulse-check of valuation relative to profitability.
Interpreting a PE ratio, however, is not just about the number itself. Growth expectations, future risk, and profitability all play significant roles in determining what a “fair” or typical PE should be. Rapid earnings growth or lower perceived risk often justifies a higher PE, while slower growth or greater uncertainty can weigh it down.
Currently, Airbus trades at a PE of 33.17x. This is lower than the Aerospace & Defense industry average of 48.25x, and just below the average of its closest peers at 34.99x. These benchmarks can be useful, but they do not reflect the unique characteristics of Airbus in full.
That is where Simply Wall St’s "Fair Ratio" comes in. For Airbus, the Fair Ratio is calculated at 35.31x. Unlike simple peer or sector comparisons, the Fair Ratio is tailored, factoring in specifics like Airbus’s earnings growth, industry trends, profit margins, market cap, and relevant risks. This makes it a much more personalized and insightful benchmark for valuation.
With Airbus’s current PE just slightly under its Fair Ratio, the stock appears to be valued about right with respect to its unique business outlook and fundamentals.
Result: ABOUT RIGHT

PE ratios tell one story, but what if the real opportunity lies elsewhere? Discover 1410 companies where insiders are betting big on explosive growth.
Upgrade Your Decision Making: Choose your Airbus Narrative
Earlier we mentioned that there is an even better way to understand valuation, so let's introduce you to Narratives. A Narrative is your personal story about Airbus, based on your own assumptions and expectations about the company's future revenue, earnings, margins, and risks. This approach turns dry numbers into a living perspective that connects the company’s story to a financial forecast and an estimated fair value. Narratives make this process incredibly simple and accessible with easy tools on Simply Wall St's Community page, shared by millions of investors worldwide.
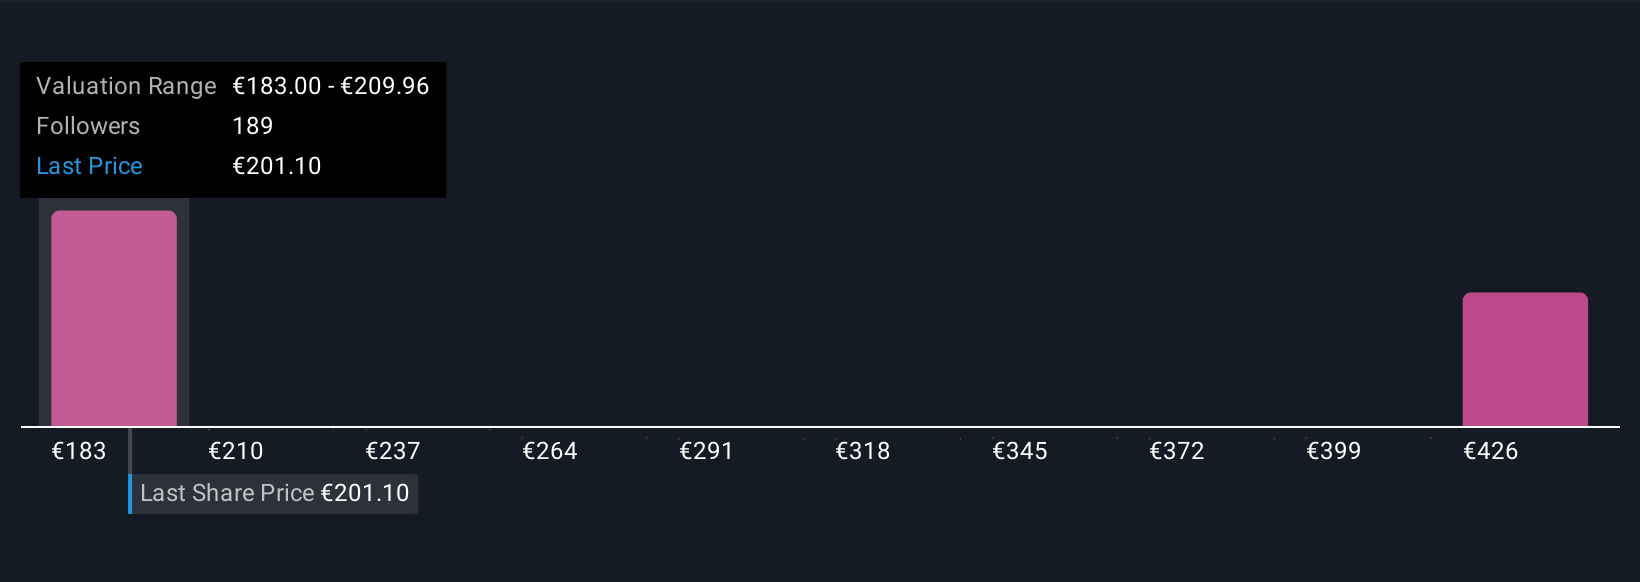
With Narratives, investors can decide when to buy or sell by directly comparing their estimated Fair Value to the current share price. Because Narratives update dynamically when news, earnings, or forecasts change, your assessment stays current. For example, one Airbus Narrative might reflect high optimism, forecasting €8.7 billion in earnings by 2028 and a fair value of €244 per share. Another, more cautious view sees only €6.1 billion in earnings and a conservative fair value of €140. This allows each investor to find a Narrative that fits their belief, making smart, informed decisions grounded in their own analysis rather than just noisy headlines.
Do you think there's more to the story for Airbus? Head over to our Community to see what others are saying!
This article by Simply Wall St is general in nature. We provide commentary based on historical data and analyst forecasts only using an unbiased methodology and our articles are not intended to be financial advice. It does not constitute a recommendation to buy or sell any stock, and does not take account of your objectives, or your financial situation. We aim to bring you long-term focused analysis driven by fundamental data. Note that our analysis may not factor in the latest price-sensitive company announcements or qualitative material. Simply Wall St has no position in any stocks mentioned.
New: Manage All Your Stock Portfolios in One Place
We've created the ultimate portfolio companion for stock investors, and it's free.
• Connect an unlimited number of Portfolios and see your total in one currency
• Be alerted to new Warning Signs or Risks via email or mobile
• Track the Fair Value of your stocks
Have feedback on this article? Concerned about the content? Get in touch with us directly. Alternatively, email editorial-team@simplywallst.com
About ENXTPA:AIR
Airbus
Engages in the design, manufacture, and delivery of aeronautics and aerospace products, services, and solutions worldwide.
Outstanding track record with flawless balance sheet.
Similar Companies
Market Insights

Advertisement
Community Narratives
The company that turned a verb into a global necessity and basically runs the modern internet, digital ads, smartphones, maps, and AI.
Fair Value US$300.00|5.4% undervalued
OS
Community Contributor
Flowers Foods Pays A Fair Price For Health
Fair Value US$16.12|26.3% undervalued
NV
Community Contributor
TMX Group will thrive with 33.3% profit margin and enduring market moat
Fair Value CA$49.90|4.1% overvalued
LI
Community Contributor
The "Molecular Pencil": Why Beam's Technology is Built to Win
Fair Value US$65.01|62.7% undervalued
DA
Community Contributor