
Advertisement
Despite lower earnings than a year ago, Sanoma Oyj (HEL:SANOMA) investors are up 63% since then
If you want to compound wealth in the stock market, you can do so by buying an index fund. But if you pick the right individual stocks, you could make more than that. To wit, the Sanoma Oyj (HEL:SANOMA) share price is 57% higher than it was a year ago, much better than the market return of around 6.3% (not including dividends) in the same period. So that should have shareholders smiling. Unfortunately the longer term returns are not so good, with the stock falling 15% in the last three years.
Since the long term performance has been good but there's been a recent pullback of 4.1%, let's check if the fundamentals match the share price.
There is no denying that markets are sometimes efficient, but prices do not always reflect underlying business performance. By comparing earnings per share (EPS) and share price changes over time, we can get a feel for how investor attitudes to a company have morphed over time.
During the last year, Sanoma Oyj actually saw its earnings per share drop 7.5%.
This means it's unlikely the market is judging the company based on earnings growth. Indeed, when EPS is declining but the share price is up, it often means the market is considering other factors.
Unfortunately Sanoma Oyj's fell 3.9% over twelve months. So using a snapshot of key business metrics doesn't give us a good picture of why the market is bidding up the stock.
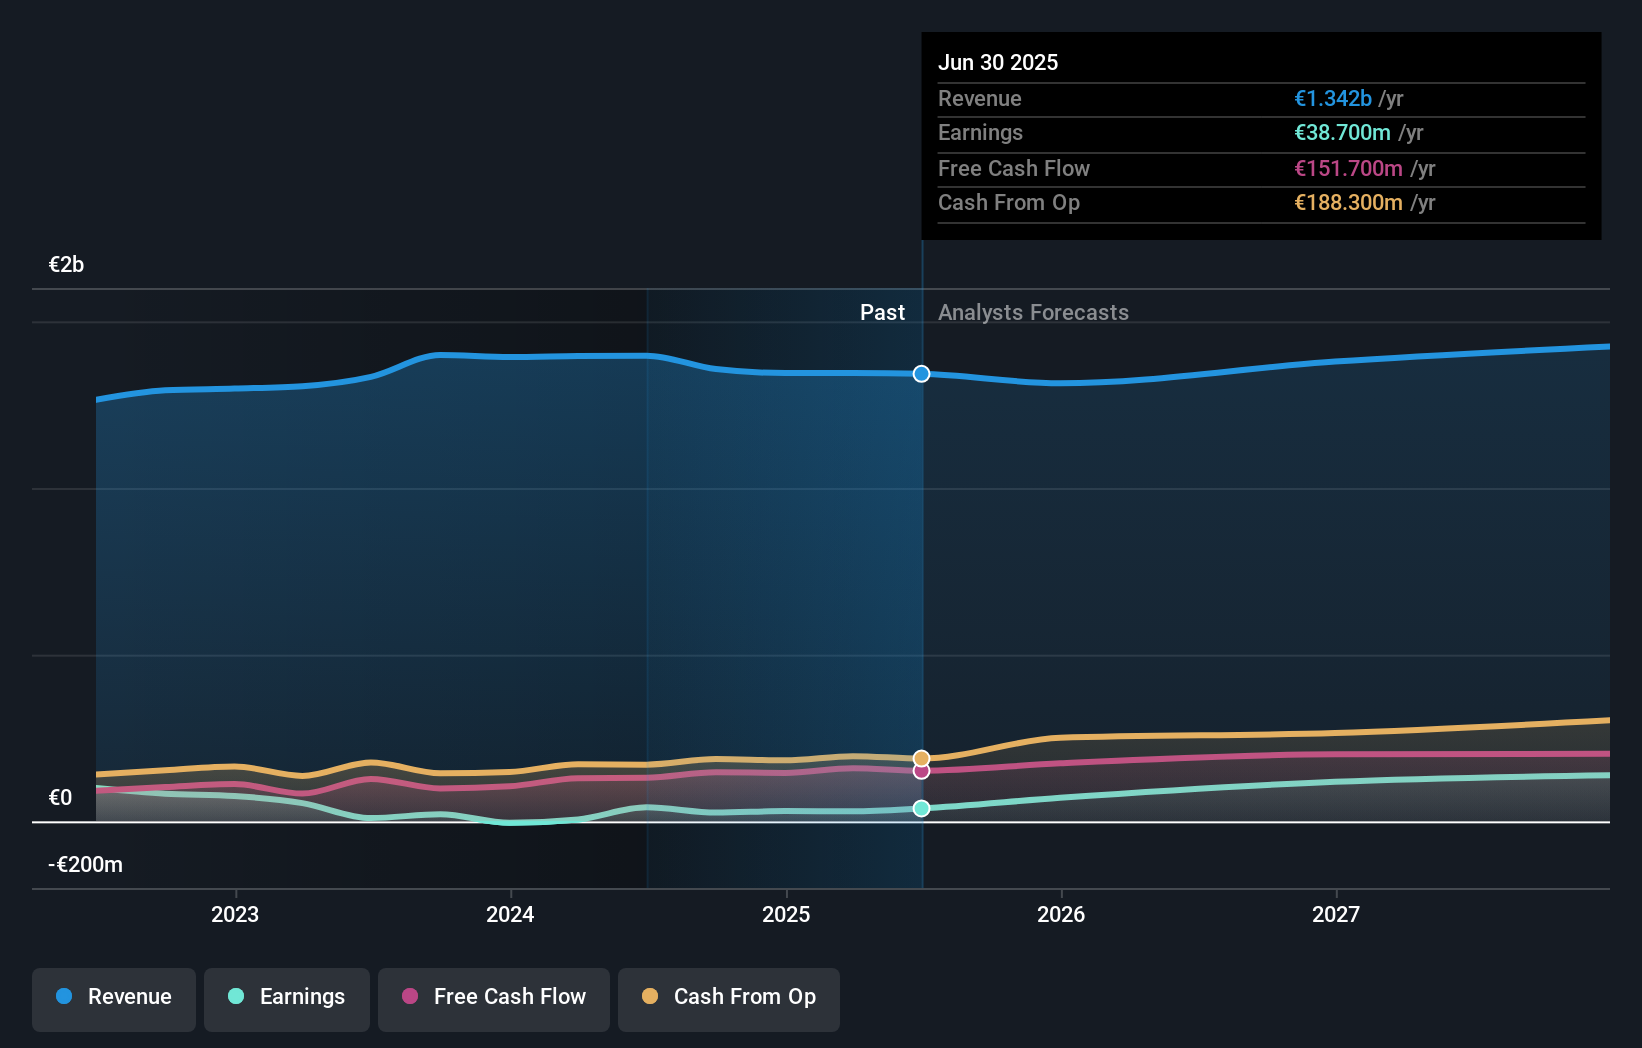
You can see how earnings and revenue have changed over time in the image below (click on the chart to see the exact values).
This free interactive report on Sanoma Oyj's balance sheet strength is a great place to start, if you want to investigate the stock further.
What About Dividends?
It is important to consider the total shareholder return, as well as the share price return, for any given stock. Whereas the share price return only reflects the change in the share price, the TSR includes the value of dividends (assuming they were reinvested) and the benefit of any discounted capital raising or spin-off. It's fair to say that the TSR gives a more complete picture for stocks that pay a dividend. In the case of Sanoma Oyj, it has a TSR of 63% for the last 1 year. That exceeds its share price return that we previously mentioned. And there's no prize for guessing that the dividend payments largely explain the divergence!
A Different Perspective
It's nice to see that Sanoma Oyj shareholders have received a total shareholder return of 63% over the last year. That's including the dividend. That's better than the annualised return of 2% over half a decade, implying that the company is doing better recently. Someone with an optimistic perspective could view the recent improvement in TSR as indicating that the business itself is getting better with time. While it is well worth considering the different impacts that market conditions can have on the share price, there are other factors that are even more important. Consider for instance, the ever-present spectre of investment risk. We've identified 3 warning signs with Sanoma Oyj , and understanding them should be part of your investment process.
Of course, you might find a fantastic investment by looking elsewhere. So take a peek at this free list of companies we expect will grow earnings.
Please note, the market returns quoted in this article reflect the market weighted average returns of stocks that currently trade on Finnish exchanges.
New: Manage All Your Stock Portfolios in One Place
We've created the ultimate portfolio companion for stock investors, and it's free.
• Connect an unlimited number of Portfolios and see your total in one currency
• Be alerted to new Warning Signs or Risks via email or mobile
• Track the Fair Value of your stocks
Have feedback on this article? Concerned about the content? Get in touch with us directly. Alternatively, email editorial-team (at) simplywallst.com.
This article by Simply Wall St is general in nature. We provide commentary based on historical data and analyst forecasts only using an unbiased methodology and our articles are not intended to be financial advice. It does not constitute a recommendation to buy or sell any stock, and does not take account of your objectives, or your financial situation. We aim to bring you long-term focused analysis driven by fundamental data. Note that our analysis may not factor in the latest price-sensitive company announcements or qualitative material. Simply Wall St has no position in any stocks mentioned.
About HLSE:SANOMA
Sanoma Oyj
Operates as a media and learning company in Finland, the Netherlands, Poland, Spain, Belgium, and internationally.
Fair value with moderate growth potential.
Similar Companies
Market Insights


Advertisement
Community Narratives
The Next Phase of Energy Storage: How NeoVolta Is Tackling America’s Power Crunch
Fair Value US$7.50|40.5% undervalued
MA
Community Contributor
Why EnSilica is Worth Possibly 13x its Current Price
Fair Value UK£5.00|91.8% undervalued
DO
Community Contributor
M&A Activity, Industry Diversification & A Defense Contract Monopoly Will Push BWXT For Healthy Long-Term Growth
Fair Value US$220.00|16.2% undervalued
CL
Community Contributor
A case for Cassiar Gold Corp (TSXV: GLDC) to reach CAD$8-10 before 2030 (X30-37)
Fair Value CA$10.00|97.5% undervalued
AG
Community Contributor