
Advertisement
Is Quonia Socimi, S.A.'s (BME:YQUO) Stock Price Struggling As A Result Of Its Mixed Financials?

With its stock down 12% over the past week, it is easy to disregard Quonia Socimi (BME:YQUO). It seems that the market might have completely ignored the positive aspects of the company's fundamentals and decided to weigh-in more on the negative aspects. Fundamentals usually dictate market outcomes so it makes sense to study the company's financials. Particularly, we will be paying attention to Quonia Socimi's ROE today.
Return on equity or ROE is a key measure used to assess how efficiently a company's management is utilizing the company's capital. In other words, it is a profitability ratio which measures the rate of return on the capital provided by the company's shareholders.
View our latest analysis for Quonia Socimi
How To Calculate Return On Equity?
Return on equity can be calculated by using the formula:
Return on Equity = Net Profit (from continuing operations) ÷ Shareholders' Equity
So, based on the above formula, the ROE for Quonia Socimi is:
4.4% = €1.7m ÷ €38m (Based on the trailing twelve months to December 2023).
The 'return' is the yearly profit. So, this means that for every €1 of its shareholder's investments, the company generates a profit of €0.04.
What Is The Relationship Between ROE And Earnings Growth?
So far, we've learned that ROE is a measure of a company's profitability. Based on how much of its profits the company chooses to reinvest or "retain", we are then able to evaluate a company's future ability to generate profits. Assuming all else is equal, companies that have both a higher return on equity and higher profit retention are usually the ones that have a higher growth rate when compared to companies that don't have the same features.
Quonia Socimi's Earnings Growth And 4.4% ROE
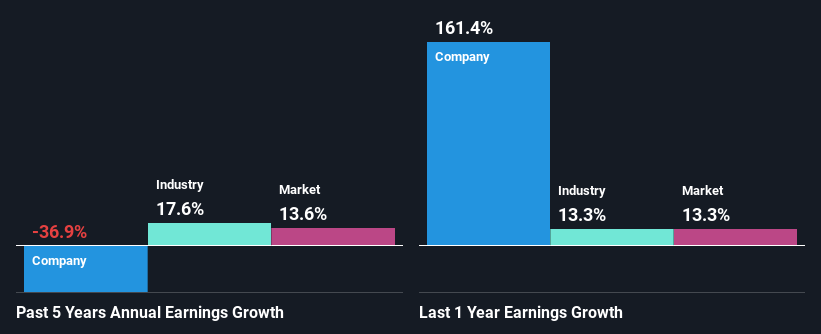
On the face of it, Quonia Socimi's ROE is not much to talk about. Yet, a closer study shows that the company's ROE is similar to the industry average of 4.4%. But Quonia Socimi saw a five year net income decline of 37% over the past five years. Bear in mind, the company does have a slightly low ROE. So that's what might be causing earnings growth to shrink.
That being said, we compared Quonia Socimi's performance with the industry and were concerned when we found that while the company has shrunk its earnings, the industry has grown its earnings at a rate of 18% in the same 5-year period.
Earnings growth is an important metric to consider when valuing a stock. It’s important for an investor to know whether the market has priced in the company's expected earnings growth (or decline). By doing so, they will have an idea if the stock is headed into clear blue waters or if swampy waters await. Is Quonia Socimi fairly valued compared to other companies? These 3 valuation measures might help you decide.
Is Quonia Socimi Using Its Retained Earnings Effectively?
Looking at its three-year median payout ratio of 43% (or a retention ratio of 57%) which is pretty normal, Quonia Socimi's declining earnings is rather baffling as one would expect to see a fair bit of growth when a company is retaining a good portion of its profits. So there might be other factors at play here which could potentially be hampering growth. For example, the business has faced some headwinds.
Additionally, Quonia Socimi started paying a dividend only recently. So it looks like the management may have perceived that shareholders favor dividends even though earnings have been in decline.
Conclusion
In total, we're a bit ambivalent about Quonia Socimi's performance. While the company does have a high rate of profit retention, its low rate of return is probably hampering its earnings growth. Wrapping up, we would proceed with caution with this company and one way of doing that would be to look at the risk profile of the business. Our risks dashboard would have the 4 risks we have identified for Quonia Socimi.
Valuation is complex, but we're here to simplify it.
Discover if Quonia Socimi might be undervalued or overvalued with our detailed analysis, featuring fair value estimates, potential risks, dividends, insider trades, and its financial condition.
Access Free AnalysisHave feedback on this article? Concerned about the content? Get in touch with us directly. Alternatively, email editorial-team (at) simplywallst.com.
This article by Simply Wall St is general in nature. We provide commentary based on historical data and analyst forecasts only using an unbiased methodology and our articles are not intended to be financial advice. It does not constitute a recommendation to buy or sell any stock, and does not take account of your objectives, or your financial situation. We aim to bring you long-term focused analysis driven by fundamental data. Note that our analysis may not factor in the latest price-sensitive company announcements or qualitative material. Simply Wall St has no position in any stocks mentioned.
Have feedback on this article? Concerned about the content? Get in touch with us directly. Alternatively, email editorial-team@simplywallst.com
About BME:YQUO
Quonia Socimi
A real estate investment fund, engages in the acquisition and management of real estate assets in Barcelona.
Proven track record with adequate balance sheet.
Market Insights


Advertisement
Community Narratives
MicroStrategy: Volatile Gamble or Golden Opportunity?
Fair Value US$663.00|33.3% undervalued
BL
Community Contributor
Emerging Markets and Debt Reduction Will Propel Bath & Body Works Forward
Fair Value US$40.73|23.4% undervalued
ZW
Community Contributor
An amazing opportunity to potentially get a 100 bagger
Fair Value US$10.00|8.5% overvalued
DA
Community Contributor