Is Vidrala, S.A.'s (BME:VID) Latest Stock Performance A Reflection Of Its Financial Health?


Most readers would already be aware that Vidrala's (BME:VID) stock increased significantly by 20% over the past three months. Given that the market rewards strong financials in the long-term, we wonder if that is the case in this instance. Particularly, we will be paying attention to Vidrala's ROE today.
Return on Equity or ROE is a test of how effectively a company is growing its value and managing investors’ money. In simpler terms, it measures the profitability of a company in relation to shareholder's equity.
Check out our latest analysis for Vidrala
How Do You Calculate Return On Equity?
The formula for return on equity is:
Return on Equity = Net Profit (from continuing operations) ÷ Shareholders' Equity
So, based on the above formula, the ROE for Vidrala is:
19% = €233m ÷ €1.2b (Based on the trailing twelve months to December 2023).
The 'return' is the income the business earned over the last year. Another way to think of that is that for every €1 worth of equity, the company was able to earn €0.19 in profit.
What Is The Relationship Between ROE And Earnings Growth?
So far, we've learned that ROE is a measure of a company's profitability. We now need to evaluate how much profit the company reinvests or "retains" for future growth which then gives us an idea about the growth potential of the company. Assuming all else is equal, companies that have both a higher return on equity and higher profit retention are usually the ones that have a higher growth rate when compared to companies that don't have the same features.
Vidrala's Earnings Growth And 19% ROE
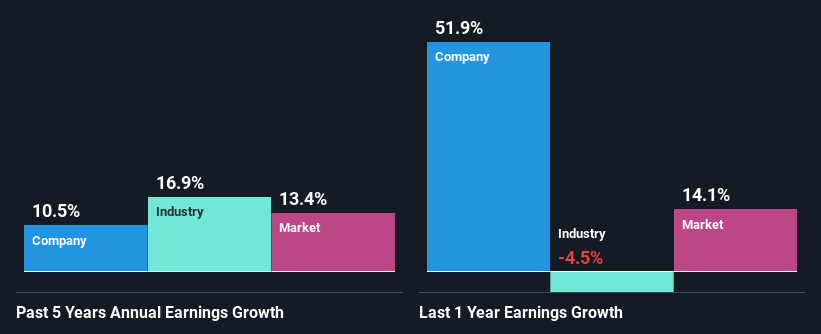
At first glance, Vidrala seems to have a decent ROE. Especially when compared to the industry average of 11% the company's ROE looks pretty impressive. This probably laid the ground for Vidrala's moderate 11% net income growth seen over the past five years.
As a next step, we compared Vidrala's net income growth with the industry and were disappointed to see that the company's growth is lower than the industry average growth of 17% in the same period.
Earnings growth is an important metric to consider when valuing a stock. What investors need to determine next is if the expected earnings growth, or the lack of it, is already built into the share price. This then helps them determine if the stock is placed for a bright or bleak future. Has the market priced in the future outlook for VID? You can find out in our latest intrinsic value infographic research report.
Is Vidrala Efficiently Re-investing Its Profits?
Vidrala's three-year median payout ratio to shareholders is 24% (implying that it retains 76% of its income), which is on the lower side, so it seems like the management is reinvesting profits heavily to grow its business.
Moreover, Vidrala is determined to keep sharing its profits with shareholders which we infer from its long history of paying a dividend for at least ten years. Based on the latest analysts' estimates, we found that the company's future payout ratio over the next three years is expected to hold steady at 21%. Therefore, the company's future ROE is also not expected to change by much with analysts predicting an ROE of 16%.
Conclusion
Overall, we are quite pleased with Vidrala's performance. In particular, it's great to see that the company is investing heavily into its business and along with a high rate of return, that has resulted in a respectable growth in its earnings. With that said, the latest industry analyst forecasts reveal that the company's earnings growth is expected to slow down. To know more about the company's future earnings growth forecasts take a look at this free report on analyst forecasts for the company to find out more.
New: Manage All Your Stock Portfolios in One Place
We've created the ultimate portfolio companion for stock investors, and it's free.
• Connect an unlimited number of Portfolios and see your total in one currency
• Be alerted to new Warning Signs or Risks via email or mobile
• Track the Fair Value of your stocks
Have feedback on this article? Concerned about the content? Get in touch with us directly. Alternatively, email editorial-team (at) simplywallst.com.
This article by Simply Wall St is general in nature. We provide commentary based on historical data and analyst forecasts only using an unbiased methodology and our articles are not intended to be financial advice. It does not constitute a recommendation to buy or sell any stock, and does not take account of your objectives, or your financial situation. We aim to bring you long-term focused analysis driven by fundamental data. Note that our analysis may not factor in the latest price-sensitive company announcements or qualitative material. Simply Wall St has no position in any stocks mentioned.
About BME:VID
Vidrala
Manufactures and sells glass containers for food and beverage products in the United Kingdom and Ireland, Italy, Iberian Peninsula and rest of Europe, and Brazil.
Flawless balance sheet, good value and pays a dividend.

