
Advertisement
Legendary fund manager Li Lu (who Charlie Munger backed) once said, 'The biggest investment risk is not the volatility of prices, but whether you will suffer a permanent loss of capital.' When we think about how risky a company is, we always like to look at its use of debt, since debt overload can lead to ruin. Importantly, Vidrala, S.A. (BME:VID) does carry debt. But the more important question is: how much risk is that debt creating?
When Is Debt Dangerous?
Generally speaking, debt only becomes a real problem when a company can't easily pay it off, either by raising capital or with its own cash flow. In the worst case scenario, a company can go bankrupt if it cannot pay its creditors. While that is not too common, we often do see indebted companies permanently diluting shareholders because lenders force them to raise capital at a distressed price. By replacing dilution, though, debt can be an extremely good tool for businesses that need capital to invest in growth at high rates of return. The first thing to do when considering how much debt a business uses is to look at its cash and debt together.
View our latest analysis for Vidrala
How Much Debt Does Vidrala Carry?
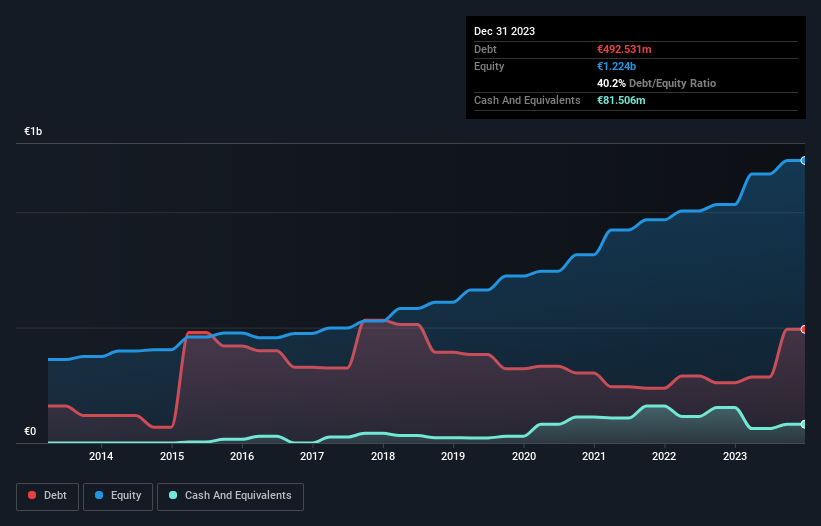
You can click the graphic below for the historical numbers, but it shows that as of December 2023 Vidrala had €492.5m of debt, an increase on €260.9m, over one year. However, it does have €81.5m in cash offsetting this, leading to net debt of about €411.0m.
How Healthy Is Vidrala's Balance Sheet?
According to the last reported balance sheet, Vidrala had liabilities of €640.2m due within 12 months, and liabilities of €617.4m due beyond 12 months. Offsetting this, it had €81.5m in cash and €400.6m in receivables that were due within 12 months. So its liabilities total €775.5m more than the combination of its cash and short-term receivables.
This deficit isn't so bad because Vidrala is worth €3.11b, and thus could probably raise enough capital to shore up its balance sheet, if the need arose. However, it is still worthwhile taking a close look at its ability to pay off debt.
We measure a company's debt load relative to its earnings power by looking at its net debt divided by its earnings before interest, tax, depreciation, and amortization (EBITDA) and by calculating how easily its earnings before interest and tax (EBIT) cover its interest expense (interest cover). The advantage of this approach is that we take into account both the absolute quantum of debt (with net debt to EBITDA) and the actual interest expenses associated with that debt (with its interest cover ratio).
Vidrala's net debt is only 1.1 times its EBITDA. And its EBIT easily covers its interest expense, being 17.7 times the size. So you could argue it is no more threatened by its debt than an elephant is by a mouse. In addition to that, we're happy to report that Vidrala has boosted its EBIT by 61%, thus reducing the spectre of future debt repayments. When analysing debt levels, the balance sheet is the obvious place to start. But ultimately the future profitability of the business will decide if Vidrala can strengthen its balance sheet over time. So if you're focused on the future you can check out this free report showing analyst profit forecasts.
Finally, while the tax-man may adore accounting profits, lenders only accept cold hard cash. So the logical step is to look at the proportion of that EBIT that is matched by actual free cash flow. Looking at the most recent three years, Vidrala recorded free cash flow of 43% of its EBIT, which is weaker than we'd expect. That weak cash conversion makes it more difficult to handle indebtedness.
Our View
Happily, Vidrala's impressive interest cover implies it has the upper hand on its debt. And the good news does not stop there, as its EBIT growth rate also supports that impression! Taking all this data into account, it seems to us that Vidrala takes a pretty sensible approach to debt. That means they are taking on a bit more risk, in the hope of boosting shareholder returns. Above most other metrics, we think its important to track how fast earnings per share is growing, if at all. If you've also come to that realization, you're in luck, because today you can view this interactive graph of Vidrala's earnings per share history for free.
Of course, if you're the type of investor who prefers buying stocks without the burden of debt, then don't hesitate to discover our exclusive list of net cash growth stocks, today.
New: Manage All Your Stock Portfolios in One Place
We've created the ultimate portfolio companion for stock investors, and it's free.
• Connect an unlimited number of Portfolios and see your total in one currency
• Be alerted to new Warning Signs or Risks via email or mobile
• Track the Fair Value of your stocks
Have feedback on this article? Concerned about the content? Get in touch with us directly. Alternatively, email editorial-team (at) simplywallst.com.
This article by Simply Wall St is general in nature. We provide commentary based on historical data and analyst forecasts only using an unbiased methodology and our articles are not intended to be financial advice. It does not constitute a recommendation to buy or sell any stock, and does not take account of your objectives, or your financial situation. We aim to bring you long-term focused analysis driven by fundamental data. Note that our analysis may not factor in the latest price-sensitive company announcements or qualitative material. Simply Wall St has no position in any stocks mentioned.
About BME:VID
Vidrala
Manufactures and sells glass containers for food and beverage products in the United Kingdom, Ireland, Italy, Iberian Peninsula, rest of Europe, and Brazil.
Very undervalued with flawless balance sheet and pays a dividend.
Market Insights

Advertisement
Community Narratives
MINISO's fair value is projected at 26.69 with an anticipated PE ratio shift of 20x
Fair Value US$24.03|11.0% undervalued
BE
Community Contributor
Procter & Gamble: A Dividend Giant Facing Slowing Growth
Fair Value US$119.81|23.3% overvalued
AN
Community Contributor
Eli Lilly's Future Growth Driven by Tirzepatide and Favorable Market Conditions
Fair Value US$1.19k|13.8% undervalued
EA
Community Contributor