
Advertisement
Declining Stock and Solid Fundamentals: Is The Market Wrong About Vidrala, S.A. (BME:VID)?
With its stock down 8.2% over the past three months, it is easy to disregard Vidrala (BME:VID). However, stock prices are usually driven by a company’s financial performance over the long term, which in this case looks quite promising. In this article, we decided to focus on Vidrala's ROE.
Return on equity or ROE is a key measure used to assess how efficiently a company's management is utilizing the company's capital. Simply put, it is used to assess the profitability of a company in relation to its equity capital.
How Do You Calculate Return On Equity?
The formula for ROE is:
Return on Equity = Net Profit (from continuing operations) ÷ Shareholders' Equity
So, based on the above formula, the ROE for Vidrala is:
17% = €235m ÷ €1.4b (Based on the trailing twelve months to June 2025).
The 'return' is the amount earned after tax over the last twelve months. One way to conceptualize this is that for each €1 of shareholders' capital it has, the company made €0.17 in profit.
View our latest analysis for Vidrala
Why Is ROE Important For Earnings Growth?
We have already established that ROE serves as an efficient profit-generating gauge for a company's future earnings. Depending on how much of these profits the company reinvests or "retains", and how effectively it does so, we are then able to assess a company’s earnings growth potential. Generally speaking, other things being equal, firms with a high return on equity and profit retention, have a higher growth rate than firms that don’t share these attributes.
Vidrala's Earnings Growth And 17% ROE
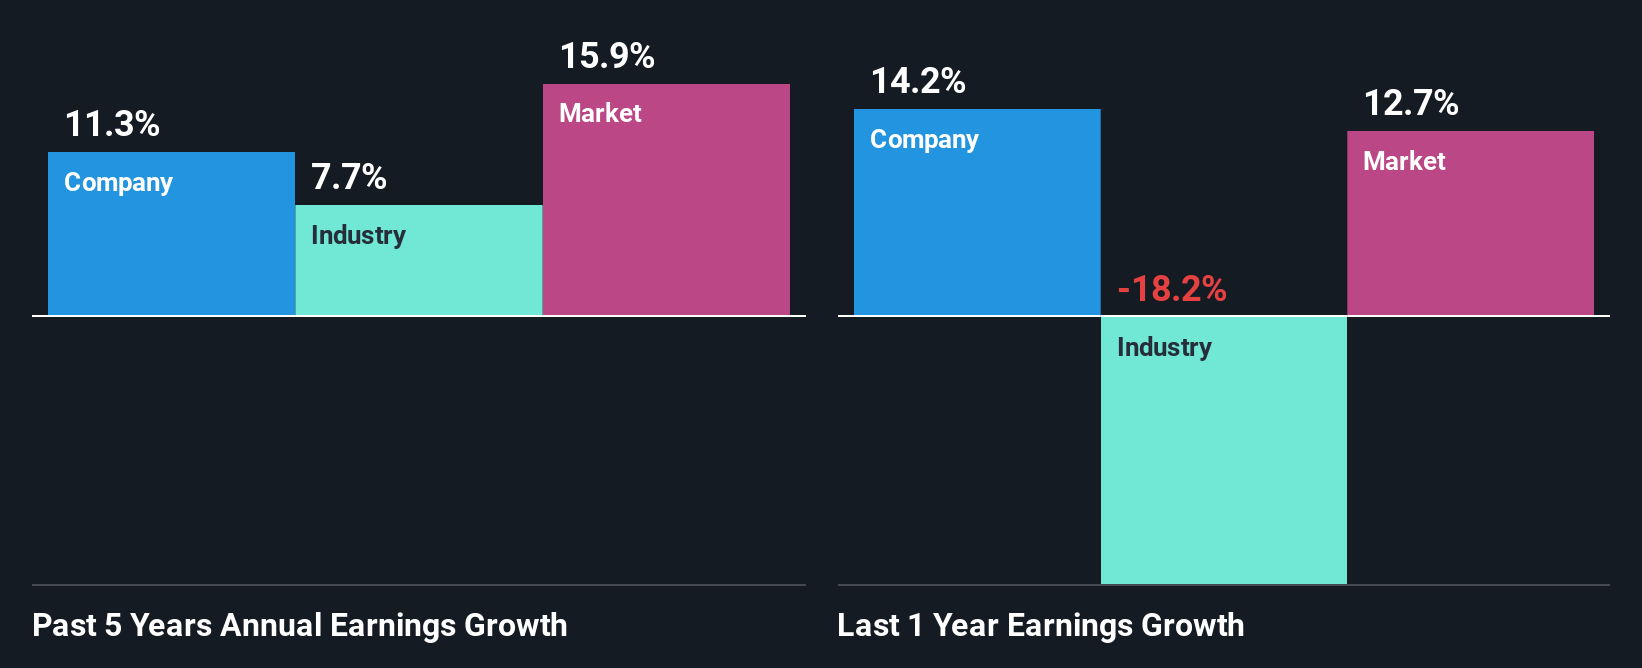
To start with, Vidrala's ROE looks acceptable. Further, the company's ROE compares quite favorably to the industry average of 9.4%. Probably as a result of this, Vidrala was able to see a decent growth of 11% over the last five years.
As a next step, we compared Vidrala's net income growth with the industry, and pleasingly, we found that the growth seen by the company is higher than the average industry growth of 7.7%.
The basis for attaching value to a company is, to a great extent, tied to its earnings growth. What investors need to determine next is if the expected earnings growth, or the lack of it, is already built into the share price. This then helps them determine if the stock is placed for a bright or bleak future. Is VID fairly valued? This infographic on the company's intrinsic value has everything you need to know.
Is Vidrala Making Efficient Use Of Its Profits?
In Vidrala's case, its respectable earnings growth can probably be explained by its low three-year median payout ratio of 22% (or a retention ratio of 78%), which suggests that the company is investing most of its profits to grow its business.
Besides, Vidrala has been paying dividends for at least ten years or more. This shows that the company is committed to sharing profits with its shareholders. Upon studying the latest analysts' consensus data, we found that the company is expected to keep paying out approximately 24% of its profits over the next three years. Therefore, the company's future ROE is also not expected to change by much with analysts predicting an ROE of 14%.
Summary
Overall, we are quite pleased with Vidrala's performance. Particularly, we like that the company is reinvesting heavily into its business, and at a high rate of return. Unsurprisingly, this has led to an impressive earnings growth. That being so, a study of the latest analyst forecasts show that the company is expected to see a slowdown in its future earnings growth. Are these analysts expectations based on the broad expectations for the industry, or on the company's fundamentals? Click here to be taken to our analyst's forecasts page for the company.
New: Manage All Your Stock Portfolios in One Place
We've created the ultimate portfolio companion for stock investors, and it's free.
• Connect an unlimited number of Portfolios and see your total in one currency
• Be alerted to new Warning Signs or Risks via email or mobile
• Track the Fair Value of your stocks
Have feedback on this article? Concerned about the content? Get in touch with us directly. Alternatively, email editorial-team (at) simplywallst.com.
This article by Simply Wall St is general in nature. We provide commentary based on historical data and analyst forecasts only using an unbiased methodology and our articles are not intended to be financial advice. It does not constitute a recommendation to buy or sell any stock, and does not take account of your objectives, or your financial situation. We aim to bring you long-term focused analysis driven by fundamental data. Note that our analysis may not factor in the latest price-sensitive company announcements or qualitative material. Simply Wall St has no position in any stocks mentioned.
About BME:VID
Vidrala
Manufactures and sells glass containers for food and beverage products in the United Kingdom, Ireland, Italy, Iberian Peninsula, rest of Europe, and Brazil.
Very undervalued with flawless balance sheet and pays a dividend.
Market Insights

Advertisement
Community Narratives
MINISO's fair value is projected at 26.69 with an anticipated PE ratio shift of 20x
Fair Value US$24.03|11.4% undervalued
BE
Community Contributor
Procter & Gamble: A Dividend Giant Facing Slowing Growth
Fair Value US$119.81|23.5% overvalued
AN
Community Contributor
Eli Lilly's Future Growth Driven by Tirzepatide and Favorable Market Conditions
Fair Value US$1.19k|14.0% undervalued
EA
Community Contributor