
Advertisement
- Spain
- /
- Electrical
- /
- BME:SPH
Profithol, S.A.'s (BME:SPH) Shares Leap 79% Yet They're Still Not Telling The Full Story
Those holding Profithol, S.A. (BME:SPH) shares would be relieved that the share price has rebounded 79% in the last thirty days, but it needs to keep going to repair the recent damage it has caused to investor portfolios. Still, the 30-day jump doesn't change the fact that longer term shareholders have seen their stock decimated by the 85% share price drop in the last twelve months.
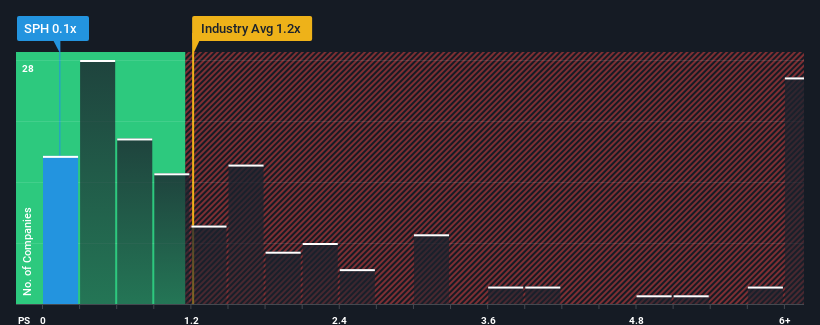
Although its price has surged higher, Profithol may still be sending bullish signals at the moment with its price-to-sales (or "P/S") ratio of 0.1x, since almost half of all companies in the Electrical industry in Spain have P/S ratios greater than 1.2x and even P/S higher than 4x are not unusual. However, the P/S might be low for a reason and it requires further investigation to determine if it's justified.
View our latest analysis for Profithol
How Has Profithol Performed Recently?
For instance, Profithol's receding revenue in recent times would have to be some food for thought. One possibility is that the P/S is low because investors think the company won't do enough to avoid underperforming the broader industry in the near future. If you like the company, you'd be hoping this isn't the case so that you could potentially pick up some stock while it's out of favour.
Although there are no analyst estimates available for Profithol, take a look at this free data-rich visualisation to see how the company stacks up on earnings, revenue and cash flow.How Is Profithol's Revenue Growth Trending?
The only time you'd be truly comfortable seeing a P/S as low as Profithol's is when the company's growth is on track to lag the industry.
Taking a look back first, the company's revenue growth last year wasn't something to get excited about as it posted a disappointing decline of 30%. However, a few very strong years before that means that it was still able to grow revenue by an impressive 261% in total over the last three years. So we can start by confirming that the company has generally done a very good job of growing revenue over that time, even though it had some hiccups along the way.
This is in contrast to the rest of the industry, which is expected to grow by 11% over the next year, materially lower than the company's recent medium-term annualised growth rates.
With this in mind, we find it intriguing that Profithol's P/S isn't as high compared to that of its industry peers. Apparently some shareholders believe the recent performance has exceeded its limits and have been accepting significantly lower selling prices.
What Does Profithol's P/S Mean For Investors?
Despite Profithol's share price climbing recently, its P/S still lags most other companies. We'd say the price-to-sales ratio's power isn't primarily as a valuation instrument but rather to gauge current investor sentiment and future expectations.
Our examination of Profithol revealed its three-year revenue trends aren't boosting its P/S anywhere near as much as we would have predicted, given they look better than current industry expectations. Potential investors that are sceptical over continued revenue performance may be preventing the P/S ratio from matching previous strong performance. It appears many are indeed anticipating revenue instability, because the persistence of these recent medium-term conditions would normally provide a boost to the share price.
You always need to take note of risks, for example - Profithol has 5 warning signs we think you should be aware of.
It's important to make sure you look for a great company, not just the first idea you come across. So if growing profitability aligns with your idea of a great company, take a peek at this free list of interesting companies with strong recent earnings growth (and a low P/E).
New: Manage All Your Stock Portfolios in One Place
We've created the ultimate portfolio companion for stock investors, and it's free.
• Connect an unlimited number of Portfolios and see your total in one currency
• Be alerted to new Warning Signs or Risks via email or mobile
• Track the Fair Value of your stocks
Have feedback on this article? Concerned about the content? Get in touch with us directly. Alternatively, email editorial-team (at) simplywallst.com.
This article by Simply Wall St is general in nature. We provide commentary based on historical data and analyst forecasts only using an unbiased methodology and our articles are not intended to be financial advice. It does not constitute a recommendation to buy or sell any stock, and does not take account of your objectives, or your financial situation. We aim to bring you long-term focused analysis driven by fundamental data. Note that our analysis may not factor in the latest price-sensitive company announcements or qualitative material. Simply Wall St has no position in any stocks mentioned.
About BME:SPH
Profithol
Engages in the installation and sale of photovoltaic panels for residential and industrial applications in Spain.
Slight risk and slightly overvalued.
Market Insights

Advertisement
Weekly Picks
RO


RockeTeller on Santacruz Silver Mining ·
Crazy Undervalued 42 Baggers Silver Play (Active & Running Mine)
Fair Value:CA$8696.7% undervalued
49 followersusers have followed this narrative
6 commentsusers have commented on this narrative
16 likesusers have liked this narrative
RO


Robbo on Fiducian Group ·
Fiducian: Compliance Clouds or Value Opportunity?
Fair Value:AU$122.0% undervalued
7 followersusers have followed this narrative
0 commentsusers have commented on this narrative
0 likesusers have liked this narrative
WO

woodworthfund on Willamette Valley Vineyards ·
Willamette Valley Vineyards (WVVI): Not-So-Great Value
Fair Value:US$247.5% overvalued
9 followersusers have followed this narrative
0 commentsusers have commented on this narrative
1 likeusers have liked this narrative
Recently Updated Narratives
IN

IncomeAssets on Pulse Seismic ·
Watch Pulse Seismic Outperform with 13.6% Revenue Growth in the Coming Years
Fair Value:CA$4.4729.5% undervalued
2 followersusers have followed this narrative
0 commentsusers have commented on this narrative
0 likesusers have liked this narrative
VL

Vladislav on Galleon Gold ·
Significantly undervalued gold explorer in Timmins, finally getting traction
Fair Value:CA$482.8% undervalued
5 followersusers have followed this narrative
0 commentsusers have commented on this narrative
0 likesusers have liked this narrative
FU

FundamentallySarcastic on Credit Corp Group ·
Moderation and Stabilisation: HOLD: Fair Price based on a 4-year Cycle is $12.08
Fair Value:AU$12.6410.8% overvalued
5 followersusers have followed this narrative
0 commentsusers have commented on this narrative
0 likesusers have liked this narrative
Popular Narratives
TH


TheWallstreetKing on MicroVision ·
MicroVision will explode future revenue by 380.37% with a vision towards success
Fair Value:US$6098.5% undervalued
116 followersusers have followed this narrative
11 commentsusers have commented on this narrative
22 likesusers have liked this narrative
AN


AnalystConsensusTarget on NVIDIA ·
NVDA: Expanding AI Demand Will Drive Major Data Center Investments Through 2026
Fair Value:US$250.3926.8% undervalued
956 followersusers have followed this narrative
6 commentsusers have commented on this narrative
25 likesusers have liked this narrative
AN

AnalystConsensusTarget on Alphabet ·
GOOGL: AI Platform Expansion And Cloud Demand Will Support Durable Performance Amid Competitive Pressures
Fair Value:US$323.71.9% undervalued
1342 followersusers have followed this narrative
0 commentsusers have commented on this narrative
17 likesusers have liked this narrative

