Advertisement
- Spain
- /
- Construction
- /
- BME:FER
Can Ferrovial’s Expansion Moves Justify Its 53% Share Price Surge?

Simply Wall St
Reviewed by Bailey Pemberton
- Wondering if Ferrovial’s surging stock price still leaves room for value, or if it’s already run too far? You’re in the right place for a deeper look at what the latest numbers really mean.
- Ferrovial’s share price has been on a wild ride, climbing 6.6% over the past month and posting an impressive 53.1% rise over the past year. This suggests investors have high hopes or see newfound potential.
- Recent headlines highlight Ferrovial’s expansion moves, including new infrastructure projects in the US and Europe. These developments have caught investors’ attention and are helping to fuel momentum, while also inviting questions about the sustainability of this rapid growth.
- All of this action means Ferrovial earns a 2/6 valuation score, reflecting that it appears undervalued in two out of six key metrics we’ll cover. We’ll dig into traditional valuation approaches in just a moment, plus stick around for what could be a smarter way to evaluate whether Ferrovial’s really a buy.
Ferrovial scores just 2/6 on our valuation checks. See what other red flags we found in the full valuation breakdown.
Approach 1: Ferrovial Discounted Cash Flow (DCF) Analysis
A Discounted Cash Flow (DCF) model estimates a company's intrinsic value by projecting its future cash flows and discounting them back to today's value. This approach helps investors understand what the business might actually be worth based on its ability to generate cash in the future.
Ferrovial's current Free Cash Flow stands at €873 million. Looking ahead, analysts forecast steady growth, expecting Free Cash Flow to reach around €1.34 billion by 2028. While direct analyst estimates cover the next five years, longer-term projections (out to 2035) are extrapolated, with Free Cash Flow expected to top €1.9 billion in that timeframe. All values are in euros to provide consistency for comparison.
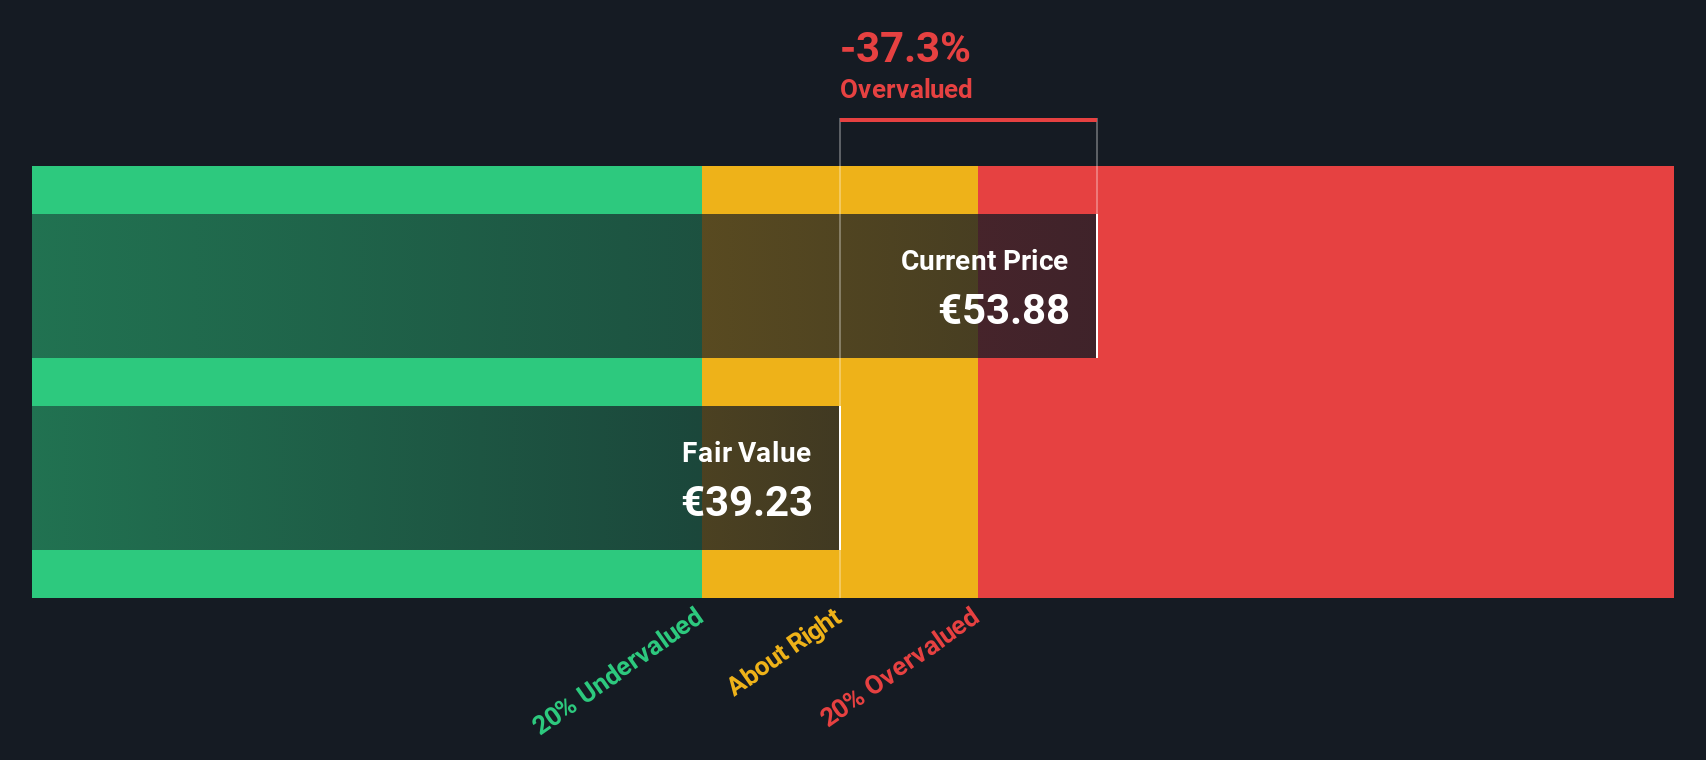
Based on these projections, the DCF model calculates an estimated intrinsic value of €39.23 per share. However, this is about 37.3% lower than the current share price, which suggests that Ferrovial stock is significantly overvalued according to this method.
Result: OVERVALUED
Our Discounted Cash Flow (DCF) analysis suggests Ferrovial may be overvalued by 37.3%. Discover 843 undervalued stocks or create your own screener to find better value opportunities.
Approach 2: Ferrovial Price vs Earnings
The Price-to-Earnings (PE) ratio is one of the most widely used valuation measures for profitable companies, as it tells investors how much they are paying for every euro of earnings. It is especially relevant for businesses like Ferrovial that are generating consistent profits, making it easy to gauge whether the stock represents good value compared to other options.
However, what counts as a “fair” PE ratio is not fixed. Growth expectations, industry dynamics, and risk levels all affect what investors are willing to pay for each unit of earnings. Faster-growing companies or those with more stable earnings often command higher PE ratios, while slower growth or higher risk would warrant a discount.
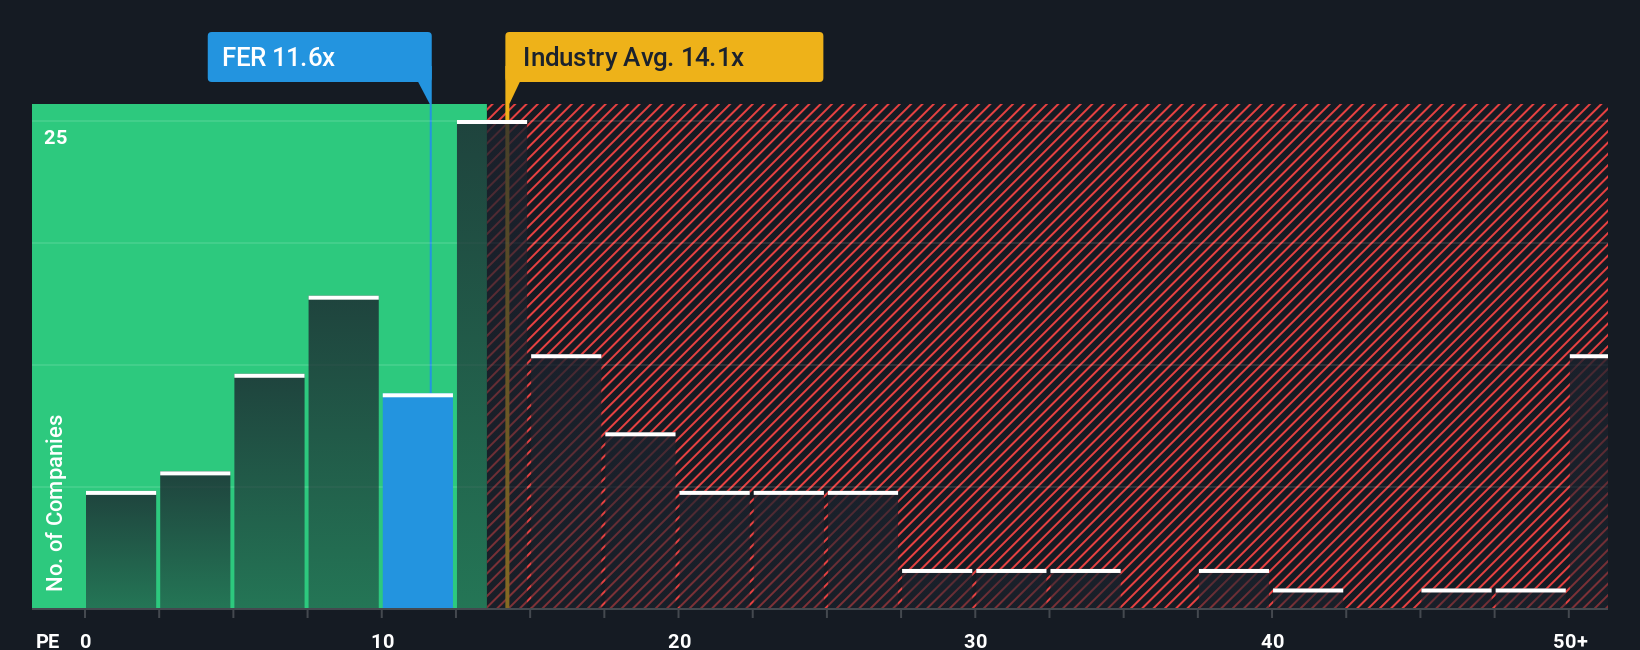
Ferrovial currently trades at a PE ratio of 11.6x, which is noticeably below both the Construction industry average of 15.9x and the peer group average of 26.2x. At first glance, this might suggest the stock is undervalued relative to its sector and direct competitors.
But to get a more tailored view, Simply Wall St uses the “Fair Ratio,” which calculates the PE multiple Ferrovial should trade at given its specific earnings growth, risks, profit margin, industry, and market cap. This approach digs deeper than basic sector comparisons, as it accounts for the qualities that actually drive value for shareholders.
Ferrovial’s Fair Ratio is 7.3x, less than its current PE of 11.6x. This indicates the market is pricing in more optimism and potentially more growth than the fundamentals alone seem to justify. Because there is a meaningful gap between the Fair Ratio and the actual multiple, Ferrovial currently appears overvalued by this metric.
Result: OVERVALUED
PE ratios tell one story, but what if the real opportunity lies elsewhere? Discover 1408 companies where insiders are betting big on explosive growth.
Upgrade Your Decision Making: Choose your Ferrovial Narrative
Earlier we mentioned that there's an even better way to understand valuation, so let's introduce you to Narratives. A Narrative is an investor’s unique story for a company, weaving together their beliefs about Ferrovial’s strategy, future revenue, profit margins, risks, and ultimately, the fair value they assign to its shares.
Instead of relying just on traditional metrics, Narratives connect your view of Ferrovial’s business drivers directly to financial forecasts and a clear estimate of what the stock is worth. This hands-on approach is easy to use and available right now within Simply Wall St’s Community page, used by millions of investors.
With Narratives, you can easily compare your fair value against the current share price and see whether your story suggests now is a good buying opportunity, or if you should wait. The best part is, Narratives update automatically as new earnings or news emerge, so your investment thesis stays fresh and relevant.
For example, some investors see risk ahead if U.S. infrastructure momentum slows or margins compress, giving them a lower fair value for Ferrovial, while others are bullish on strong North American growth and sector tailwinds, assigning a much higher fair value. Both perspectives are reflected in real time on the platform.
Do you think there's more to the story for Ferrovial? Head over to our Community to see what others are saying!

This article by Simply Wall St is general in nature. We provide commentary based on historical data and analyst forecasts only using an unbiased methodology and our articles are not intended to be financial advice. It does not constitute a recommendation to buy or sell any stock, and does not take account of your objectives, or your financial situation. We aim to bring you long-term focused analysis driven by fundamental data. Note that our analysis may not factor in the latest price-sensitive company announcements or qualitative material. Simply Wall St has no position in any stocks mentioned.
New: AI Stock Screener & Alerts
Our new AI Stock Screener scans the market every day to uncover opportunities.
• Dividend Powerhouses (3%+ Yield)
• Undervalued Small Caps with Insider Buying
• High growth Tech and AI Companies
Or build your own from over 50 metrics.
Have feedback on this article? Concerned about the content? Get in touch with us directly. Alternatively, email editorial-team@simplywallst.com
About BME:FER
Ferrovial
Engages in the design, construction, financing, operation, and maintenance of transport infrastructure and urban services internationally.
Proven track record with low risk.
Similar Companies
Market Insights

Advertisement
Community Narratives
The company that turned a verb into a global necessity and basically runs the modern internet, digital ads, smartphones, maps, and AI.
Fair Value US$300.00|5.4% undervalued
OS
Community Contributor
Flowers Foods Pays A Fair Price For Health
Fair Value US$16.12|26.3% undervalued
NV
Community Contributor
TMX Group will thrive with 33.3% profit margin and enduring market moat
Fair Value CA$49.90|4.1% overvalued
LI
Community Contributor