
Advertisement
We Think Harboes Bryggeri (CPH:HARB B) Has A Fair Chunk Of Debt
Some say volatility, rather than debt, is the best way to think about risk as an investor, but Warren Buffett famously said that 'Volatility is far from synonymous with risk.' It's only natural to consider a company's balance sheet when you examine how risky it is, since debt is often involved when a business collapses. As with many other companies Harboes Bryggeri A/S (CPH:HARB B) makes use of debt. But is this debt a concern to shareholders?
Why Does Debt Bring Risk?
Debt assists a business until the business has trouble paying it off, either with new capital or with free cash flow. In the worst case scenario, a company can go bankrupt if it cannot pay its creditors. However, a more frequent (but still costly) occurrence is where a company must issue shares at bargain-basement prices, permanently diluting shareholders, just to shore up its balance sheet. Of course, debt can be an important tool in businesses, particularly capital heavy businesses. When we examine debt levels, we first consider both cash and debt levels, together.
Check out our latest analysis for Harboes Bryggeri
What Is Harboes Bryggeri's Net Debt?
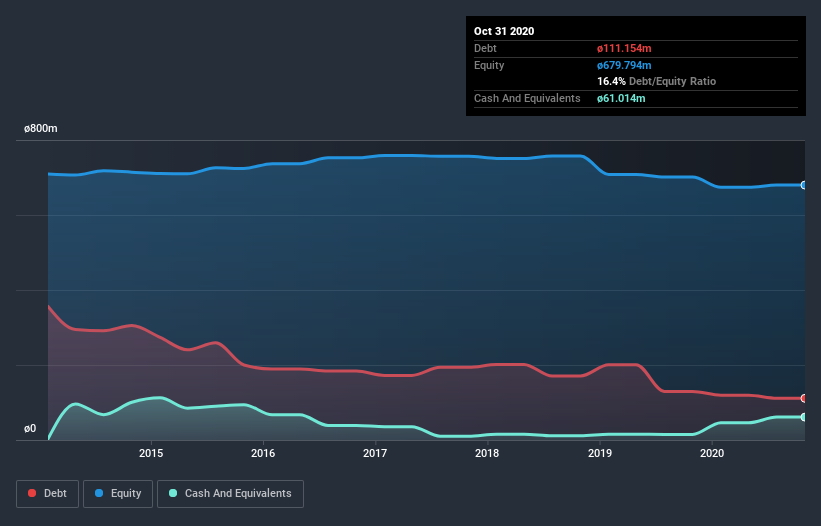
The image below, which you can click on for greater detail, shows that Harboes Bryggeri had debt of kr.111.2m at the end of October 2020, a reduction from kr.129.6m over a year. On the flip side, it has kr.61.0m in cash leading to net debt of about kr.50.1m.
How Strong Is Harboes Bryggeri's Balance Sheet?
Zooming in on the latest balance sheet data, we can see that Harboes Bryggeri had liabilities of kr.286.1m due within 12 months and liabilities of kr.197.9m due beyond that. Offsetting this, it had kr.61.0m in cash and kr.219.2m in receivables that were due within 12 months. So its liabilities outweigh the sum of its cash and (near-term) receivables by kr.203.7m.
This is a mountain of leverage relative to its market capitalization of kr.312.5m. This suggests shareholders would be heavily diluted if the company needed to shore up its balance sheet in a hurry. There's no doubt that we learn most about debt from the balance sheet. But you can't view debt in total isolation; since Harboes Bryggeri will need earnings to service that debt. So if you're keen to discover more about its earnings, it might be worth checking out this graph of its long term earnings trend.
Over 12 months, Harboes Bryggeri saw its revenue hold pretty steady, and it did not report positive earnings before interest and tax. While that's not too bad, we'd prefer see growth.
Caveat Emptor
Over the last twelve months Harboes Bryggeri produced an earnings before interest and tax (EBIT) loss. To be specific the EBIT loss came in at kr.19m. Considering that alongside the liabilities mentioned above does not give us much confidence that company should be using so much debt. Quite frankly we think the balance sheet is far from match-fit, although it could be improved with time. For example, we would not want to see a repeat of last year's loss of kr.19m. So in short it's a really risky stock. When analysing debt levels, the balance sheet is the obvious place to start. However, not all investment risk resides within the balance sheet - far from it. For instance, we've identified 2 warning signs for Harboes Bryggeri (1 is potentially serious) you should be aware of.
If you're interested in investing in businesses that can grow profits without the burden of debt, then check out this free list of growing businesses that have net cash on the balance sheet.
If you’re looking to trade Harboes Bryggeri, open an account with the lowest-cost* platform trusted by professionals, Interactive Brokers. Their clients from over 200 countries and territories trade stocks, options, futures, forex, bonds and funds worldwide from a single integrated account. Promoted
Valuation is complex, but we're here to simplify it.
Discover if Harboes Bryggeri might be undervalued or overvalued with our detailed analysis, featuring fair value estimates, potential risks, dividends, insider trades, and its financial condition.
Access Free AnalysisThis article by Simply Wall St is general in nature. It does not constitute a recommendation to buy or sell any stock, and does not take account of your objectives, or your financial situation. We aim to bring you long-term focused analysis driven by fundamental data. Note that our analysis may not factor in the latest price-sensitive company announcements or qualitative material. Simply Wall St has no position in any stocks mentioned.
*Interactive Brokers Rated Lowest Cost Broker by StockBrokers.com Annual Online Review 2020
Have feedback on this article? Concerned about the content? Get in touch with us directly. Alternatively, email editorial-team@simplywallst.com.
About CPSE:HARB B
Harboes Bryggeri
Develops, produces, and markets beverages and malt-based food ingredients worldwide.
Excellent balance sheet and slightly overvalued.
Market Insights


Advertisement
Community Narratives
Alphabet: The Under-appreciated Compounder Hiding in Plain Sight
Fair Value US$282.83|31.8% undervalued
BL
Community Contributor
Planet Labs: At The Heart Of The Emerging New Space Boom
Fair Value US$11.31|44.7% undervalued
AN
Community Contributor
Exxon in Guyana 5 year forecast Low $135 to High $189
Fair Value US$189.00|40.9% undervalued
AG
Community Contributor