
Advertisement
Howard Marks put it nicely when he said that, rather than worrying about share price volatility, 'The possibility of permanent loss is the risk I worry about... and every practical investor I know worries about.' When we think about how risky a company is, we always like to look at its use of debt, since debt overload can lead to ruin. We can see that ISS A/S (CPH:ISS) does use debt in its business. But should shareholders be worried about its use of debt?
When Is Debt Dangerous?
Debt assists a business until the business has trouble paying it off, either with new capital or with free cash flow. Ultimately, if the company can't fulfill its legal obligations to repay debt, shareholders could walk away with nothing. However, a more frequent (but still costly) occurrence is where a company must issue shares at bargain-basement prices, permanently diluting shareholders, just to shore up its balance sheet. Of course, the upside of debt is that it often represents cheap capital, especially when it replaces dilution in a company with the ability to reinvest at high rates of return. When we think about a company's use of debt, we first look at cash and debt together.
See our latest analysis for ISS
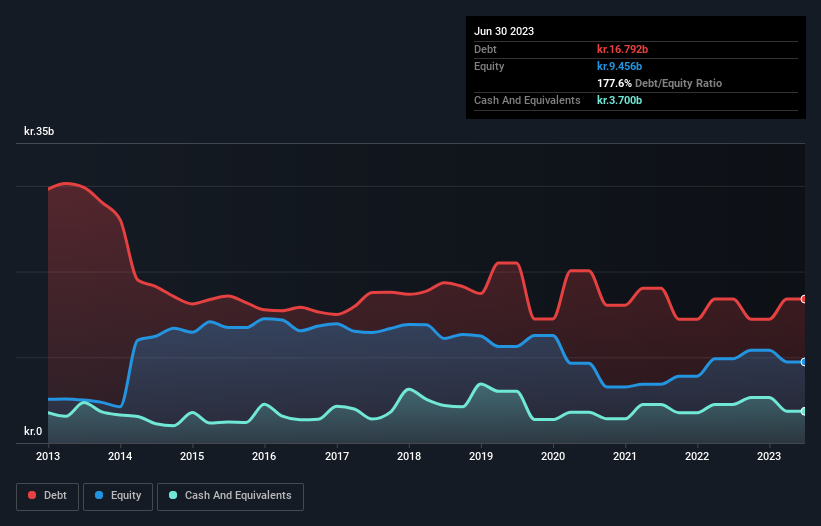
What Is ISS's Debt?
The chart below, which you can click on for greater detail, shows that ISS had kr.16.8b in debt in June 2023; about the same as the year before. On the flip side, it has kr.3.70b in cash leading to net debt of about kr.13.1b.
A Look At ISS' Liabilities
We can see from the most recent balance sheet that ISS had liabilities of kr.17.0b falling due within a year, and liabilities of kr.18.7b due beyond that. On the other hand, it had cash of kr.3.70b and kr.14.3b worth of receivables due within a year. So it has liabilities totalling kr.17.7b more than its cash and near-term receivables, combined.
This deficit is considerable relative to its market capitalization of kr.22.2b, so it does suggest shareholders should keep an eye on ISS' use of debt. Should its lenders demand that it shore up the balance sheet, shareholders would likely face severe dilution.
We measure a company's debt load relative to its earnings power by looking at its net debt divided by its earnings before interest, tax, depreciation, and amortization (EBITDA) and by calculating how easily its earnings before interest and tax (EBIT) cover its interest expense (interest cover). This way, we consider both the absolute quantum of the debt, as well as the interest rates paid on it.
ISS has net debt to EBITDA of 4.0 suggesting it uses a fair bit of leverage to boost returns. On the plus side, its EBIT was 7.8 times its interest expense, and its net debt to EBITDA, was quite high, at 4.0. It is well worth noting that ISS's EBIT shot up like bamboo after rain, gaining 39% in the last twelve months. That'll make it easier to manage its debt. There's no doubt that we learn most about debt from the balance sheet. But ultimately the future profitability of the business will decide if ISS can strengthen its balance sheet over time. So if you're focused on the future you can check out this free report showing analyst profit forecasts.
Finally, while the tax-man may adore accounting profits, lenders only accept cold hard cash. So the logical step is to look at the proportion of that EBIT that is matched by actual free cash flow. During the last two years, ISS produced sturdy free cash flow equating to 53% of its EBIT, about what we'd expect. This free cash flow puts the company in a good position to pay down debt, when appropriate.
Our View
On our analysis ISS's EBIT growth rate should signal that it won't have too much trouble with its debt. But the other factors we noted above weren't so encouraging. For instance it seems like it has to struggle a bit handle its debt, based on its EBITDA,. Looking at all this data makes us feel a little cautious about ISS's debt levels. While debt does have its upside in higher potential returns, we think shareholders should definitely consider how debt levels might make the stock more risky. When analysing debt levels, the balance sheet is the obvious place to start. However, not all investment risk resides within the balance sheet - far from it. To that end, you should learn about the 4 warning signs we've spotted with ISS (including 1 which is potentially serious) .
If, after all that, you're more interested in a fast growing company with a rock-solid balance sheet, then check out our list of net cash growth stocks without delay.
New: AI Stock Screener & Alerts
Our new AI Stock Screener scans the market every day to uncover opportunities.
• Dividend Powerhouses (3%+ Yield)
• Undervalued Small Caps with Insider Buying
• High growth Tech and AI Companies
Or build your own from over 50 metrics.
Have feedback on this article? Concerned about the content? Get in touch with us directly. Alternatively, email editorial-team (at) simplywallst.com.
This article by Simply Wall St is general in nature. We provide commentary based on historical data and analyst forecasts only using an unbiased methodology and our articles are not intended to be financial advice. It does not constitute a recommendation to buy or sell any stock, and does not take account of your objectives, or your financial situation. We aim to bring you long-term focused analysis driven by fundamental data. Note that our analysis may not factor in the latest price-sensitive company announcements or qualitative material. Simply Wall St has no position in any stocks mentioned.
About CPSE:ISS
ISS
Operates as workplace experience and facility management company in the United Kingdom, Ireland, the United States, Canada, Switzerland, Germany, Australia, New Zealand, Türkiye, Spain, Denmark, and internationally.
Good value with proven track record.
Similar Companies
Market Insights

Advertisement
Community Narratives
The company that turned a verb into a global necessity and basically runs the modern internet, digital ads, smartphones, maps, and AI.
Fair Value US$300.00|8.0% undervalued
OS
Community Contributor
Flowers Foods Pays A Fair Price For Health
Fair Value US$16.12|26.4% undervalued
NV
Community Contributor
TMX Group will thrive with 33.3% profit margin and enduring market moat
Fair Value CA$49.90|0.8% overvalued
LI
Community Contributor
The "Molecular Pencil": Why Beam's Technology is Built to Win
Fair Value US$65.01|65.8% undervalued
DA
Community Contributor