Stock Analysis
Investors in Rockwool (CPH:ROCK B) have seen favorable returns of 62% over the past year


Passive investing in index funds can generate returns that roughly match the overall market. But you can significantly boost your returns by picking above-average stocks. For example, the Rockwool A/S (CPH:ROCK B) share price is up 59% in the last 1 year, clearly besting the market return of around 32% (not including dividends). If it can keep that out-performance up over the long term, investors will do very well! Zooming out, the stock is actually down 9.8% in the last three years.
Now it's worth having a look at the company's fundamentals too, because that will help us determine if the long term shareholder return has matched the performance of the underlying business.
View our latest analysis for Rockwool
There is no denying that markets are sometimes efficient, but prices do not always reflect underlying business performance. One way to examine how market sentiment has changed over time is to look at the interaction between a company's share price and its earnings per share (EPS).
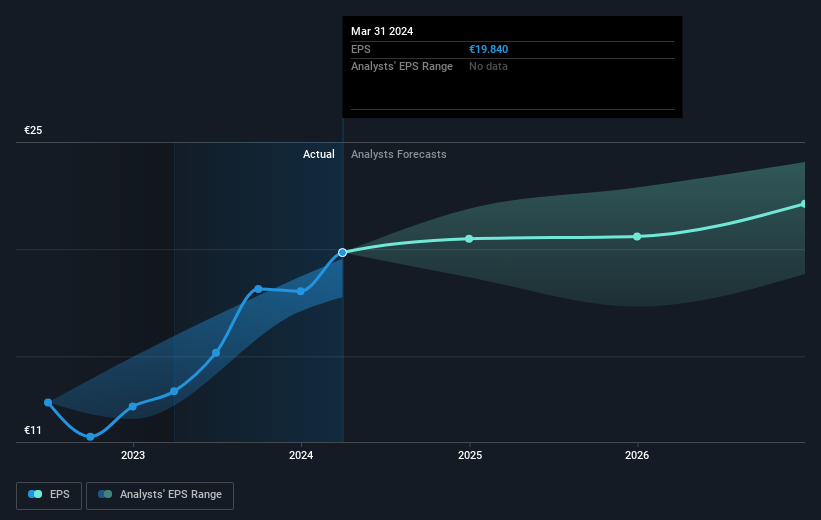
Rockwool was able to grow EPS by 48% in the last twelve months. This EPS growth is reasonably close to the 59% increase in the share price. So this implies that investor expectations of the company have remained pretty steady. It makes intuitive sense that the share price and EPS would grow at similar rates.
The company's earnings per share (over time) is depicted in the image below (click to see the exact numbers).
We know that Rockwool has improved its bottom line lately, but is it going to grow revenue? This free report showing analyst revenue forecasts should help you figure out if the EPS growth can be sustained.
What About Dividends?
As well as measuring the share price return, investors should also consider the total shareholder return (TSR). The TSR incorporates the value of any spin-offs or discounted capital raisings, along with any dividends, based on the assumption that the dividends are reinvested. So for companies that pay a generous dividend, the TSR is often a lot higher than the share price return. In the case of Rockwool, it has a TSR of 62% for the last 1 year. That exceeds its share price return that we previously mentioned. And there's no prize for guessing that the dividend payments largely explain the divergence!
A Different Perspective
It's nice to see that Rockwool shareholders have received a total shareholder return of 62% over the last year. That's including the dividend. That gain is better than the annual TSR over five years, which is 12%. Therefore it seems like sentiment around the company has been positive lately. In the best case scenario, this may hint at some real business momentum, implying that now could be a great time to delve deeper. Before forming an opinion on Rockwool you might want to consider these 3 valuation metrics.
Of course Rockwool may not be the best stock to buy. So you may wish to see this free collection of growth stocks.
Please note, the market returns quoted in this article reflect the market weighted average returns of stocks that currently trade on Danish exchanges.
Valuation is complex, but we're helping make it simple.
Find out whether Rockwool is potentially over or undervalued by checking out our comprehensive analysis, which includes fair value estimates, risks and warnings, dividends, insider transactions and financial health.
View the Free AnalysisHave feedback on this article? Concerned about the content? Get in touch with us directly. Alternatively, email editorial-team (at) simplywallst.com.
This article by Simply Wall St is general in nature. We provide commentary based on historical data and analyst forecasts only using an unbiased methodology and our articles are not intended to be financial advice. It does not constitute a recommendation to buy or sell any stock, and does not take account of your objectives, or your financial situation. We aim to bring you long-term focused analysis driven by fundamental data. Note that our analysis may not factor in the latest price-sensitive company announcements or qualitative material. Simply Wall St has no position in any stocks mentioned.
About CPSE:ROCK B
Rockwool
Produces and sells stone wool insulation products in Western Europe, Eastern Europe, North America, Asia, and internationally.
Flawless balance sheet with solid track record and pays a dividend.
