Stock Analysis
- Denmark
- /
- Electrical
- /
- CPSE:NKT
NKT's (CPH:NKT) investors will be pleased with their incredible 632% return over the last five years


For many, the main point of investing in the stock market is to achieve spectacular returns. And highest quality companies can see their share prices grow by huge amounts. For example, the NKT A/S (CPH:NKT) share price is up a whopping 494% in the last half decade, a handsome return for long term holders. This just goes to show the value creation that some businesses can achieve. Also pleasing for shareholders was the 18% gain in the last three months. But this could be related to the strong market, which is up 7.7% in the last three months.
So let's assess the underlying fundamentals over the last 5 years and see if they've moved in lock-step with shareholder returns.
Check out our latest analysis for NKT
While markets are a powerful pricing mechanism, share prices reflect investor sentiment, not just underlying business performance. One way to examine how market sentiment has changed over time is to look at the interaction between a company's share price and its earnings per share (EPS).
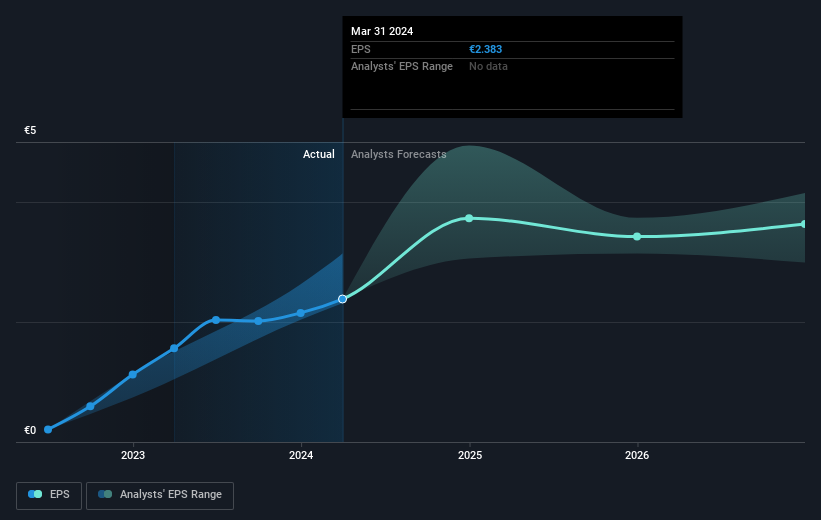
During the last half decade, NKT became profitable. Sometimes, the start of profitability is a major inflection point that can signal fast earnings growth to come, which in turn justifies very strong share price gains.
The company's earnings per share (over time) is depicted in the image below (click to see the exact numbers).
We like that insiders have been buying shares in the last twelve months. Having said that, most people consider earnings and revenue growth trends to be a more meaningful guide to the business. It might be well worthwhile taking a look at our free report on NKT's earnings, revenue and cash flow.
What About The Total Shareholder Return (TSR)?
We'd be remiss not to mention the difference between NKT's total shareholder return (TSR) and its share price return. The TSR attempts to capture the value of dividends (as if they were reinvested) as well as any spin-offs or discounted capital raisings offered to shareholders. Its history of dividend payouts mean that NKT's TSR of 632% over the last 5 years is better than the share price return.
A Different Perspective
It's nice to see that NKT shareholders have received a total shareholder return of 61% over the last year. That's better than the annualised return of 49% over half a decade, implying that the company is doing better recently. In the best case scenario, this may hint at some real business momentum, implying that now could be a great time to delve deeper. It's always interesting to track share price performance over the longer term. But to understand NKT better, we need to consider many other factors. For instance, we've identified 1 warning sign for NKT that you should be aware of.
NKT is not the only stock insiders are buying. So take a peek at this free list of small cap companies at attractive valuations which insiders have been buying.
Please note, the market returns quoted in this article reflect the market weighted average returns of stocks that currently trade on Danish exchanges.
Valuation is complex, but we're helping make it simple.
Find out whether NKT is potentially over or undervalued by checking out our comprehensive analysis, which includes fair value estimates, risks and warnings, dividends, insider transactions and financial health.
View the Free AnalysisHave feedback on this article? Concerned about the content? Get in touch with us directly. Alternatively, email editorial-team (at) simplywallst.com.
This article by Simply Wall St is general in nature. We provide commentary based on historical data and analyst forecasts only using an unbiased methodology and our articles are not intended to be financial advice. It does not constitute a recommendation to buy or sell any stock, and does not take account of your objectives, or your financial situation. We aim to bring you long-term focused analysis driven by fundamental data. Note that our analysis may not factor in the latest price-sensitive company announcements or qualitative material. Simply Wall St has no position in any stocks mentioned.
About CPSE:NKT
NKT
Develops, manufactures, and markets cables, accessories, and solutions in Denmark and internationally.
Flawless balance sheet with solid track record.
