Advertisement
SJF Bank (CPSE:SPKSJF) Margin Compression Undercuts Bullish Narrative After Years of Earnings Growth

Simply Wall St
Reviewed by Simply Wall St
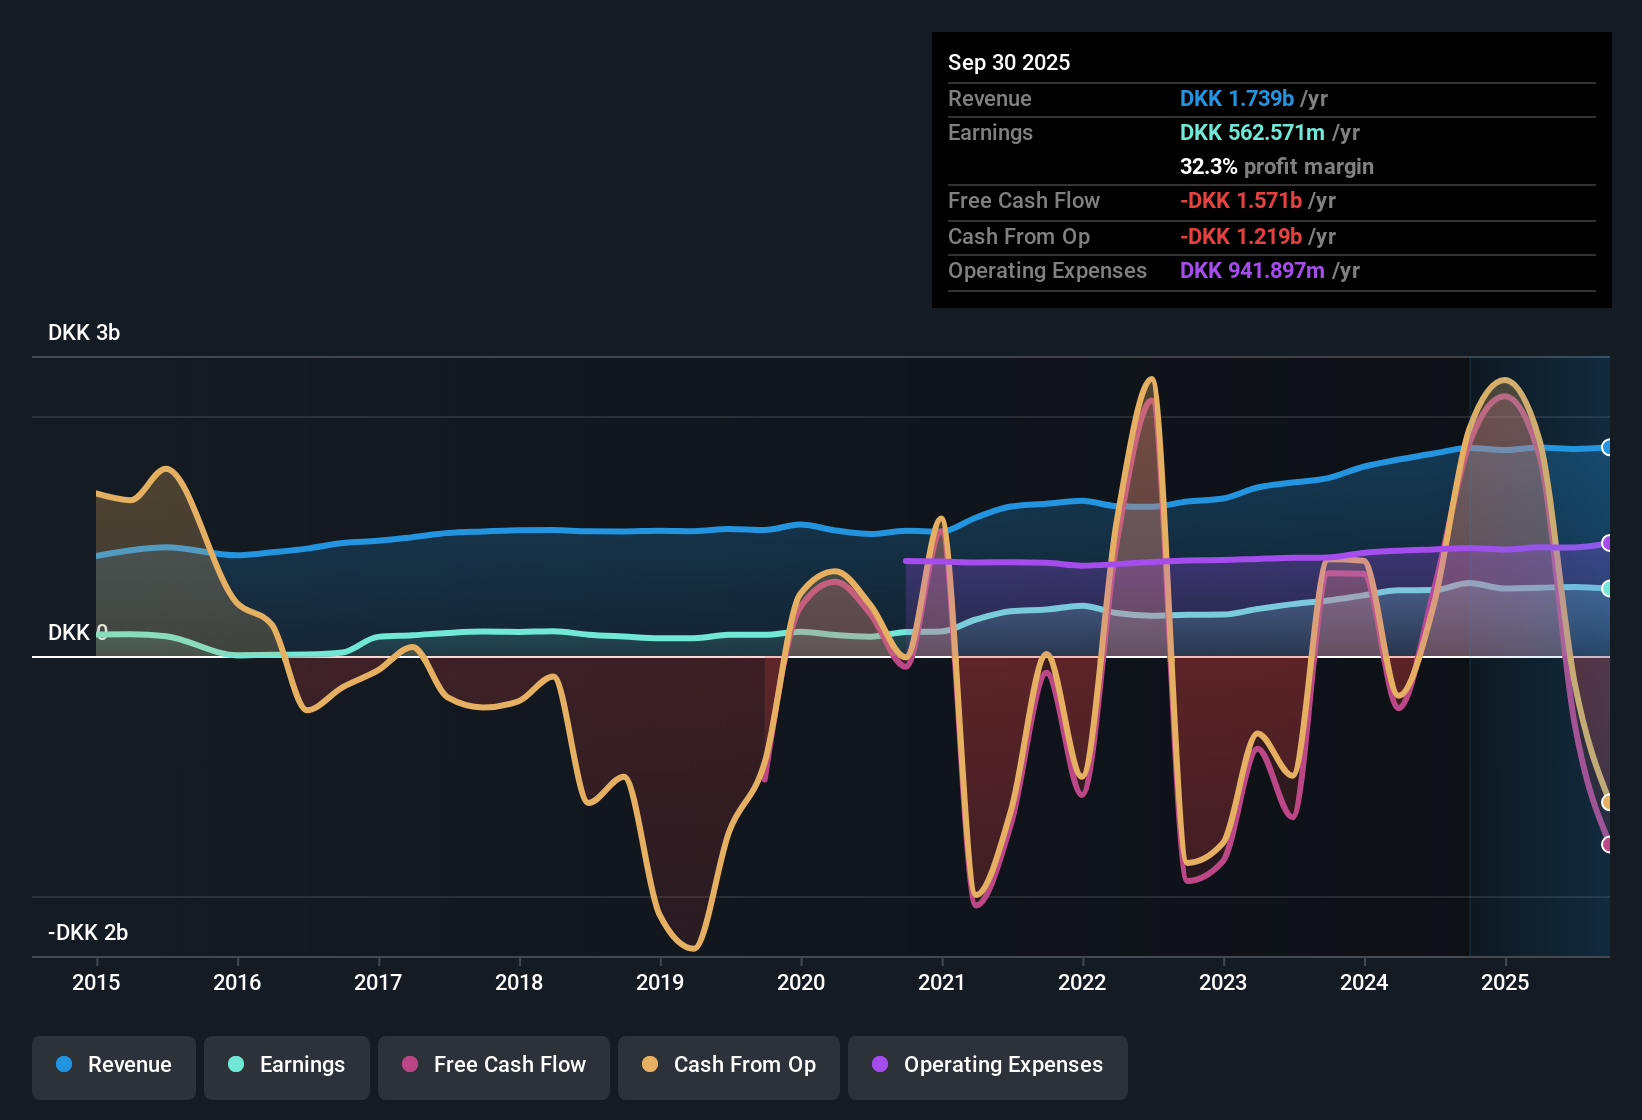
SJF Bank (CPSE:SPKSJF) posted a net profit margin of 32.3% for the recent period, down from 35.1% a year ago. Over the past five years, annual earnings growth averaged 16.9%, but the most recent year saw a reversal with negative growth. Investors are weighing this decline in profitability against SJF Bank’s track record of strong multi-year earnings and its valuation, with the stock trading under fair value and showing a price-to-earnings ratio of 10x, roughly in line with the industry average.
See our full analysis for SJF Bank.The next section will put these headline numbers side by side with the current narratives around SJF Bank, examining how the facts support, contradict, or nuance investor sentiment.
Curious how numbers become stories that shape markets? Explore Community Narratives
Multi-Year Growth Stalls After Long Run
- Five-year annual earnings growth averaged a robust 16.9%, but the most recent year marked an abrupt reversal, with overall earnings declining instead of continuing the prior expansion.
- While bulls typically point to SJF Bank’s strong long-term compound growth as evidence of structural strength, the sharp downturn in the latest period raises two key questions:
- Does a single year of negative growth reflect a temporary setback, or is it a sign that the previous pace is not sustainable?
- Despite the five-year growth streak, the recent earnings decline tempers even a bullish thesis that once counted on momentum carrying forward.
Margin Compression Signals Profit Headwinds
- Net profit margin decreased to 32.3% in the latest results, a notable drop from the prior year’s 35.1%. This shows that cost pressures or a less favorable mix have started to impact the bank’s bottom line.
- The prevailing market view highlights how this margin shift could indicate stiffer competition or higher costs:
- With profitability narrowing, even a solid revenue base may not translate into the same level of net earnings going forward.
- This development makes it harder for even optimistic investors to argue for immediate upside unless SJF Bank can demonstrate efficiency gains or regain prior margin levels.
Trading Below Fair Value Adds Intrigue
- SJF Bank’s current share price of 344.00 is significantly below the DCF fair value estimate of 625.27, suggesting a wide valuation gap that stands out compared to the sector.
- From the prevailing market view, this discount generates both opportunity and uncertainty for investors:
- Bulls may argue the low price bakes in recent negative growth and leaves room for upside if fundamentals recover, yet the margin decline and earnings drop could signal a new normal rather than a temporary setback.
- This gap between market price and modeled fair value encourages a close watch on upcoming results to see if valuation converges upwards or if fundamentals justify the caution embedded in today’s price.
Have a read of the narrative in full and understand what's behind the forecasts.
Next Steps
Don't just look at this quarter; the real story is in the long-term trend. We've done an in-depth analysis on SJF Bank's growth and its valuation to see if today's price is a bargain. Add the company to your watchlist or portfolio now so you don't miss the next big move.
See What Else Is Out There
SJF Bank’s recent negative earnings growth and margin compression suggest its earlier pace may be hard to sustain, which could indicate less consistent performance ahead.
If you’re seeking steadier results, use our stable growth stocks screener ( results) to spot companies delivering consistent earnings and revenue growth even when industry leaders lose momentum.
This article by Simply Wall St is general in nature. We provide commentary based on historical data and analyst forecasts only using an unbiased methodology and our articles are not intended to be financial advice. It does not constitute a recommendation to buy or sell any stock, and does not take account of your objectives, or your financial situation. We aim to bring you long-term focused analysis driven by fundamental data. Note that our analysis may not factor in the latest price-sensitive company announcements or qualitative material. Simply Wall St has no position in any stocks mentioned.
New: Manage All Your Stock Portfolios in One Place
We've created the ultimate portfolio companion for stock investors, and it's free.
• Connect an unlimited number of Portfolios and see your total in one currency
• Be alerted to new Warning Signs or Risks via email or mobile
• Track the Fair Value of your stocks
Have feedback on this article? Concerned about the content? Get in touch with us directly. Alternatively, email editorial-team@simplywallst.com
About CPSE:SPKSJF
SJF Bank
A savings bank, provides financial products and services to private and corporate customers.
Adequate balance sheet and fair value.
Market Insights

Advertisement
Community Narratives
The company that turned a verb into a global necessity and basically runs the modern internet, digital ads, smartphones, maps, and AI.
Fair Value US$300.00|5.1% undervalued
OS
Community Contributor
Flowers Foods Pays A Fair Price For Health
Fair Value US$16.12|27.7% undervalued
NV
Community Contributor
TMX Group will thrive with 33.3% profit margin and enduring market moat
Fair Value CA$49.90|0.2% overvalued
LI
Community Contributor
The "Molecular Pencil": Why Beam's Technology is Built to Win
Fair Value US$65.01|64.4% undervalued
DA
Community Contributor