- Germany
- /
- Other Utilities
- /
- XTRA:MVV1
Assessing MVV Energie (XTRA:MVV1) Valuation After a 4% Share Price Rise Over Three Months

Reviewed by Simply Wall St
MVV Energie (XTRA:MVV1) has attracted attention in recent weeks, with shares climbing roughly 4% over the past 3 months. Investors are watching to see whether recent momentum continues at current valuation levels.
See our latest analysis for MVV Energie.
MVV Energie's share price at €31.1 reflects a steady upward trend, with a 4% return over the past three months and a 5.7% total shareholder return over the last year. Recent gains suggest growing optimism. The stock’s long-term performance remains the real story.
If MVV Energie’s momentum has you looking to uncover your next opportunity, broaden your search and discover fast growing stocks with high insider ownership
The key question now is whether MVV Energie’s solid recent returns mean the stock is still undervalued, or if the market has already accounted for any upside ahead. Is there a buying opportunity, or is growth fully priced in?
Price-to-Earnings of 13.4x: Is it justified?
MVV Energie is trading at a price-to-earnings (P/E) ratio of 13.4x, placing it below both its peer group and the industry averages. With a last close price of €31.1, this suggests investors may be underpricing the company’s earnings potential compared to other integrated utilities.
The price-to-earnings ratio is a direct measure of how much investors are willing to pay per euro of net profit. For utility companies like MVV Energie, which often have more stable earnings streams, this metric helps investors weigh whether the share price fairly reflects current and expected profitability.
MVV Energie’s P/E of 13.4x is notably lower than the German market average of 17.9x, as well as the global integrated utilities industry average of 18.1x and the peer group average of 16.7x. This significant discount points to potential undervaluation by the market and could represent an opportunity for investors looking for relatively lower-priced exposure in this sector.
See what the numbers say about this price — find out in our valuation breakdown.
Result: Price-to-Earnings of 13.4x (UNDERVALUED)
However, if the absence of visible revenue and net income growth continues, it could challenge the bullish outlook and place future earnings momentum at risk.
Find out about the key risks to this MVV Energie narrative.
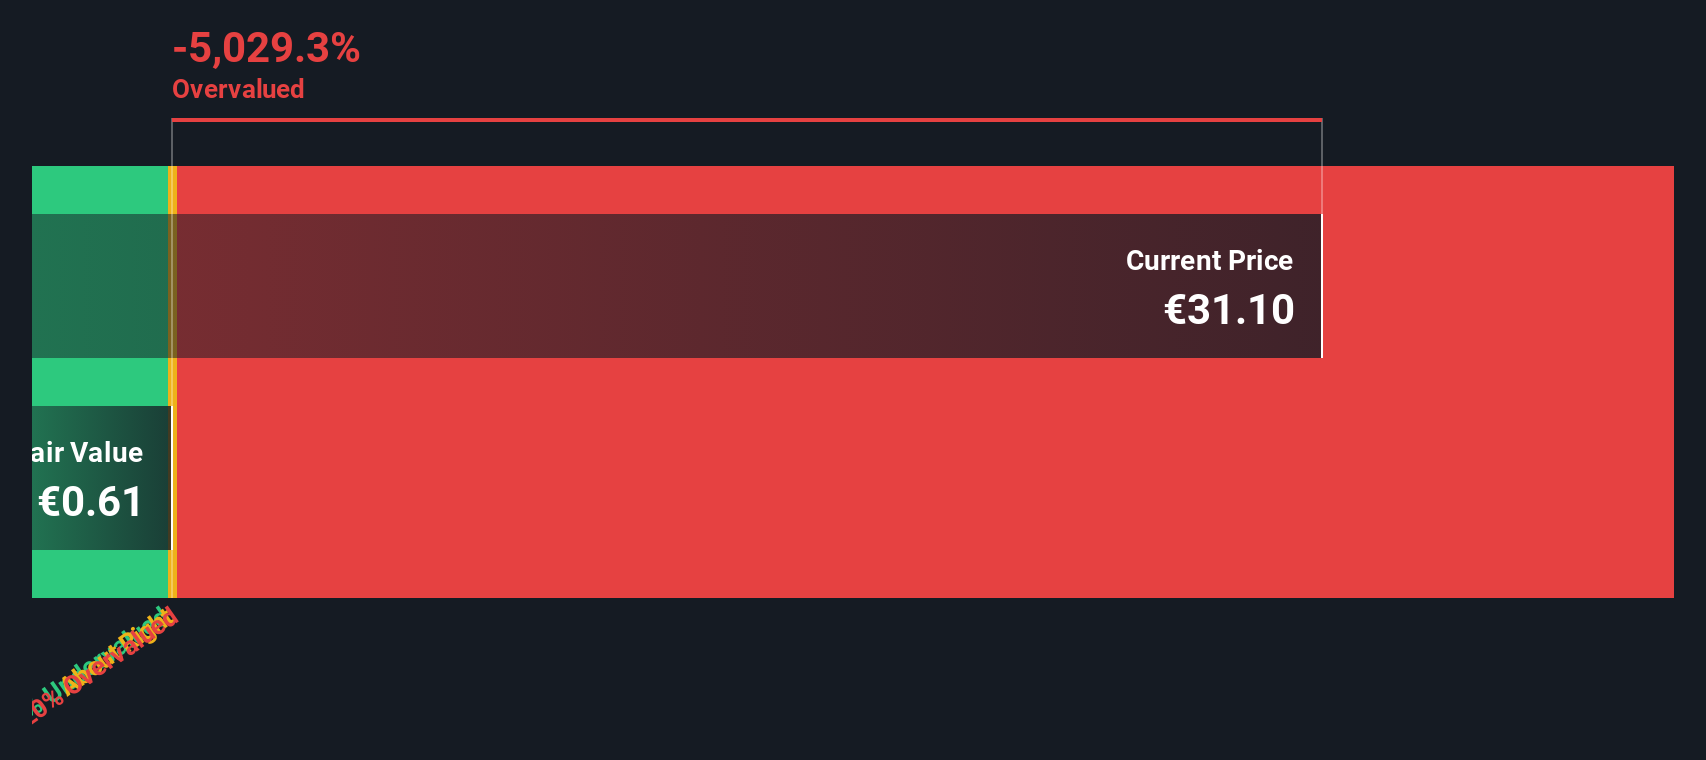
Another View: DCF Model Challenges the Undervaluation Case
While the price-to-earnings ratio shows MVV Energie as undervalued versus its peers, our SWS DCF model takes a much stricter view. This method estimates MVV Energie’s fair value at just €0.61, compared to its recent price of €31.1. By this measure, the shares appear overvalued. Could the market be ignoring longer-term cash flow risks?
Look into how the SWS DCF model arrives at its fair value.
Simply Wall St performs a discounted cash flow (DCF) on every stock in the world every day (check out MVV Energie for example). We show the entire calculation in full. You can track the result in your watchlist or portfolio and be alerted when this changes, or use our stock screener to discover 833 undervalued stocks based on their cash flows. If you save a screener we even alert you when new companies match - so you never miss a potential opportunity.
Build Your Own MVV Energie Narrative
If you’d like to reach your own conclusions or challenge these findings, you can build a fresh narrative for MVV Energie in just a few minutes with Do it your way.
A great starting point for your MVV Energie research is our analysis highlighting 1 key reward and 2 important warning signs that could impact your investment decision.
Looking for more investment ideas?
Unlock your next big winner by tapping into hand-picked investment ideas tailored to different market trends and growth stories, all with the Simply Wall St Screener.
- Capitalize on the growth of digital health. Start with these 33 healthcare AI stocks to spot companies transforming patient care with powerful AI-driven solutions.
- Enjoy regular payouts by selecting these 22 dividend stocks with yields > 3% that offer attractive yields and stand out for their financial reliability.
- Position yourself ahead of tech advancements by reviewing these 28 quantum computing stocks, where breakthroughs in quantum computing could signal tomorrow’s hottest stocks.
This article by Simply Wall St is general in nature. We provide commentary based on historical data and analyst forecasts only using an unbiased methodology and our articles are not intended to be financial advice. It does not constitute a recommendation to buy or sell any stock, and does not take account of your objectives, or your financial situation. We aim to bring you long-term focused analysis driven by fundamental data. Note that our analysis may not factor in the latest price-sensitive company announcements or qualitative material. Simply Wall St has no position in any stocks mentioned.
Mobile Infrastructure for Defense and Disaster
The next wave in robotics isn't humanoid. Its fully autonomous towers delivering 5G, ISR, and radar in under 30 minutes, anywhere.
Get the investor briefing before the next round of contracts
Sponsored On Behalf of CiTechNew: Manage All Your Stock Portfolios in One Place
We've created the ultimate portfolio companion for stock investors, and it's free.
• Connect an unlimited number of Portfolios and see your total in one currency
• Be alerted to new Warning Signs or Risks via email or mobile
• Track the Fair Value of your stocks
Have feedback on this article? Concerned about the content? Get in touch with us directly. Alternatively, email editorial-team@simplywallst.com
About XTRA:MVV1
MVV Energie
Provides electricity, heat, gas, water, and waste treatment and disposal products primarily in Germany.
Flawless balance sheet, good value and pays a dividend.
Similar Companies
Market Insights

Weekly Picks

Early mover in a fast growing industry. Likely to experience share price volatility as they scale


A case for CA$31.80 (undiluted), aka 8,616% upside from CA$0.37 (an 86 bagger!).


Moderation and Stabilisation: HOLD: Fair Price based on a 4-year Cycle is $12.08
Recently Updated Narratives

Airbnb Stock: Platform Growth in a World of Saturation and Scrutiny

Clarivate Stock: When Data Becomes the Backbone of Innovation and Law

Adobe Stock: AI-Fueled ARR Growth Pushes Guidance Higher, But Cost Pressures Loom
Popular Narratives


Crazy Undervalued 42 Baggers Silver Play (Active & Running Mine)


NVDA: Expanding AI Demand Will Drive Major Data Center Investments Through 2026


MicroVision will explode future revenue by 380.37% with a vision towards success
Trending Discussion
