- Germany
- /
- Wireless Telecom
- /
- XTRA:FNTN
Slowing Rates Of Return At freenet (ETR:FNTN) Leave Little Room For Excitement

If you're not sure where to start when looking for the next multi-bagger, there are a few key trends you should keep an eye out for. Firstly, we'll want to see a proven return on capital employed (ROCE) that is increasing, and secondly, an expanding base of capital employed. This shows us that it's a compounding machine, able to continually reinvest its earnings back into the business and generate higher returns. However, after briefly looking over the numbers, we don't think freenet (ETR:FNTN) has the makings of a multi-bagger going forward, but let's have a look at why that may be.
Return On Capital Employed (ROCE): What Is It?
Just to clarify if you're unsure, ROCE is a metric for evaluating how much pre-tax income (in percentage terms) a company earns on the capital invested in its business. The formula for this calculation on freenet is:
Return on Capital Employed = Earnings Before Interest and Tax (EBIT) ÷ (Total Assets - Current Liabilities)
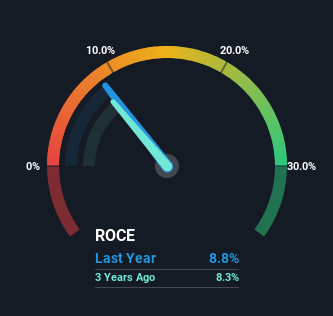
0.088 = €192m ÷ (€3.3b - €1.1b) (Based on the trailing twelve months to September 2023).
Therefore, freenet has an ROCE of 8.8%. Even though it's in line with the industry average of 8.9%, it's still a low return by itself.
View our latest analysis for freenet
In the above chart we have measured freenet's prior ROCE against its prior performance, but the future is arguably more important. If you'd like to see what analysts are forecasting going forward, you should check out our free report for freenet.
What The Trend Of ROCE Can Tell Us
We've noticed that although returns on capital are flat over the last five years, the amount of capital employed in the business has fallen 43% in that same period. To us that doesn't look like a multi-bagger because the company appears to be selling assets and it's returns aren't increasing. Not only that, but the low returns on this capital mentioned earlier would leave most investors unimpressed.
Another point to note, we noticed the company has increased current liabilities over the last five years. This is intriguing because if current liabilities hadn't increased to 34% of total assets, this reported ROCE would probably be less than8.8% because total capital employed would be higher.The 8.8% ROCE could be even lower if current liabilities weren't 34% of total assets, because the the formula would show a larger base of total capital employed. So while current liabilities isn't high right now, keep an eye out in case it increases further, because this can introduce some elements of risk.
Our Take On freenet's ROCE
In summary, freenet isn't reinvesting funds back into the business and returns aren't growing. Yet to long term shareholders the stock has gifted them an incredible 101% return in the last five years, so the market appears to be rosy about its future. However, unless these underlying trends turn more positive, we wouldn't get our hopes up too high.
One more thing, we've spotted 1 warning sign facing freenet that you might find interesting.
If you want to search for solid companies with great earnings, check out this free list of companies with good balance sheets and impressive returns on equity.
The New Payments ETF Is Live on NASDAQ:
Money is moving to real-time rails, and a newly listed ETF now gives investors direct exposure. Fast settlement. Institutional custody. Simple access.
Explore how this launch could reshape portfolios
Sponsored ContentValuation is complex, but we're here to simplify it.
Discover if freenet might be undervalued or overvalued with our detailed analysis, featuring fair value estimates, potential risks, dividends, insider trades, and its financial condition.
Access Free AnalysisHave feedback on this article? Concerned about the content? Get in touch with us directly. Alternatively, email editorial-team (at) simplywallst.com.
This article by Simply Wall St is general in nature. We provide commentary based on historical data and analyst forecasts only using an unbiased methodology and our articles are not intended to be financial advice. It does not constitute a recommendation to buy or sell any stock, and does not take account of your objectives, or your financial situation. We aim to bring you long-term focused analysis driven by fundamental data. Note that our analysis may not factor in the latest price-sensitive company announcements or qualitative material. Simply Wall St has no position in any stocks mentioned.
About XTRA:FNTN
freenet
Provides telecommunications, broadcasting, and multimedia services for mobile communications/mobile internet, and digital lifestyle sectors in Germany.
Undervalued with excellent balance sheet and pays a dividend.
Similar Companies
Market Insights

Weekly Picks

Early mover in a fast growing industry. Likely to experience share price volatility as they scale


A case for CA$31.80 (undiluted), aka 8,616% upside from CA$0.37 (an 86 bagger!).


Moderation and Stabilisation: HOLD: Fair Price based on a 4-year Cycle is $12.08
Recently Updated Narratives

Airbnb Stock: Platform Growth in a World of Saturation and Scrutiny

Adobe Stock: AI-Fueled ARR Growth Pushes Guidance Higher, But Cost Pressures Loom

Thomson Reuters Stock: When Legal Intelligence Becomes Mission-Critical Infrastructure
Popular Narratives


Crazy Undervalued 42 Baggers Silver Play (Active & Running Mine)


NVDA: Expanding AI Demand Will Drive Major Data Center Investments Through 2026

The AI Infrastructure Giant Grows Into Its Valuation
Trending Discussion

