Stock Analysis
Novabase S.G.P.S' (FRA:NVQ) five-year earnings growth trails the incredible shareholder returns


When you buy shares in a company, it's worth keeping in mind the possibility that it could fail, and you could lose your money. But on the bright side, if you buy shares in a high quality company at the right price, you can gain well over 100%. One great example is Novabase S.G.P.S., S.A. (FRA:NVQ) which saw its share price drive 193% higher over five years. In more good news, the share price has risen 16% in thirty days.
On the back of a solid 7-day performance, let's check what role the company's fundamentals have played in driving long term shareholder returns.
See our latest analysis for Novabase S.G.P.S
While markets are a powerful pricing mechanism, share prices reflect investor sentiment, not just underlying business performance. One imperfect but simple way to consider how the market perception of a company has shifted is to compare the change in the earnings per share (EPS) with the share price movement.
During five years of share price growth, Novabase S.G.P.S achieved compound earnings per share (EPS) growth of 16% per year. This EPS growth is lower than the 24% average annual increase in the share price. This suggests that market participants hold the company in higher regard, these days. That's not necessarily surprising considering the five-year track record of earnings growth. This favorable sentiment is reflected in its (fairly optimistic) P/E ratio of 62.81.
The image below shows how EPS has tracked over time (if you click on the image you can see greater detail).
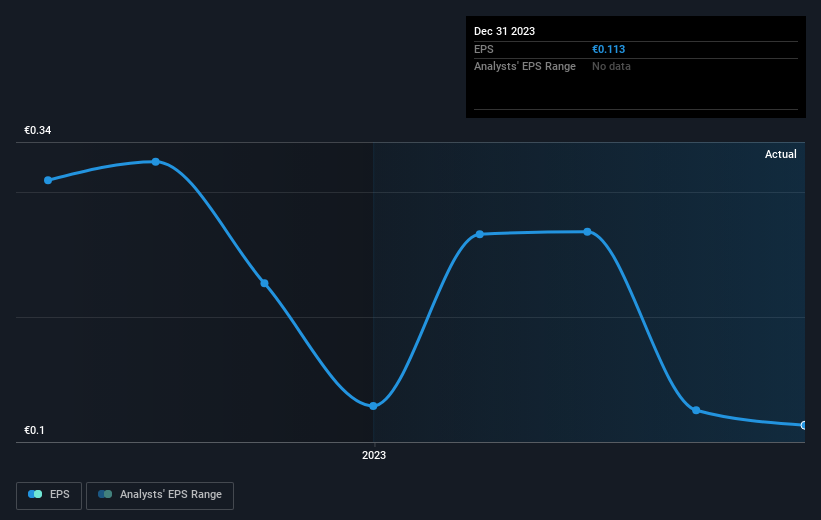
Dive deeper into Novabase S.G.P.S' key metrics by checking this interactive graph of Novabase S.G.P.S's earnings, revenue and cash flow.
What About Dividends?
It is important to consider the total shareholder return, as well as the share price return, for any given stock. The TSR is a return calculation that accounts for the value of cash dividends (assuming that any dividend received was reinvested) and the calculated value of any discounted capital raisings and spin-offs. So for companies that pay a generous dividend, the TSR is often a lot higher than the share price return. In the case of Novabase S.G.P.S, it has a TSR of 325% for the last 5 years. That exceeds its share price return that we previously mentioned. And there's no prize for guessing that the dividend payments largely explain the divergence!
A Different Perspective
It's nice to see that Novabase S.G.P.S shareholders have received a total shareholder return of 64% over the last year. Of course, that includes the dividend. That gain is better than the annual TSR over five years, which is 34%. Therefore it seems like sentiment around the company has been positive lately. In the best case scenario, this may hint at some real business momentum, implying that now could be a great time to delve deeper. I find it very interesting to look at share price over the long term as a proxy for business performance. But to truly gain insight, we need to consider other information, too. For example, we've discovered 2 warning signs for Novabase S.G.P.S (1 doesn't sit too well with us!) that you should be aware of before investing here.
For those who like to find winning investments this free list of undervalued companies with recent insider purchasing, could be just the ticket.
Please note, the market returns quoted in this article reflect the market weighted average returns of stocks that currently trade on German exchanges.
Valuation is complex, but we're helping make it simple.
Find out whether Novabase S.G.P.S is potentially over or undervalued by checking out our comprehensive analysis, which includes fair value estimates, risks and warnings, dividends, insider transactions and financial health.
View the Free AnalysisHave feedback on this article? Concerned about the content? Get in touch with us directly. Alternatively, email editorial-team (at) simplywallst.com.
This article by Simply Wall St is general in nature. We provide commentary based on historical data and analyst forecasts only using an unbiased methodology and our articles are not intended to be financial advice. It does not constitute a recommendation to buy or sell any stock, and does not take account of your objectives, or your financial situation. We aim to bring you long-term focused analysis driven by fundamental data. Note that our analysis may not factor in the latest price-sensitive company announcements or qualitative material. Simply Wall St has no position in any stocks mentioned.
About DB:NVQ
Novabase S.G.P.S
Through its subsidiaries, provides IT consulting and services in Portugal, rest of Europe, Africa, the Middle East, and internationally.
Excellent balance sheet second-rate dividend payer.
