
Advertisement
Does This Valuation Of Northern Data AG (FRA:NB2) Imply Investors Are Overpaying?
Key Insights
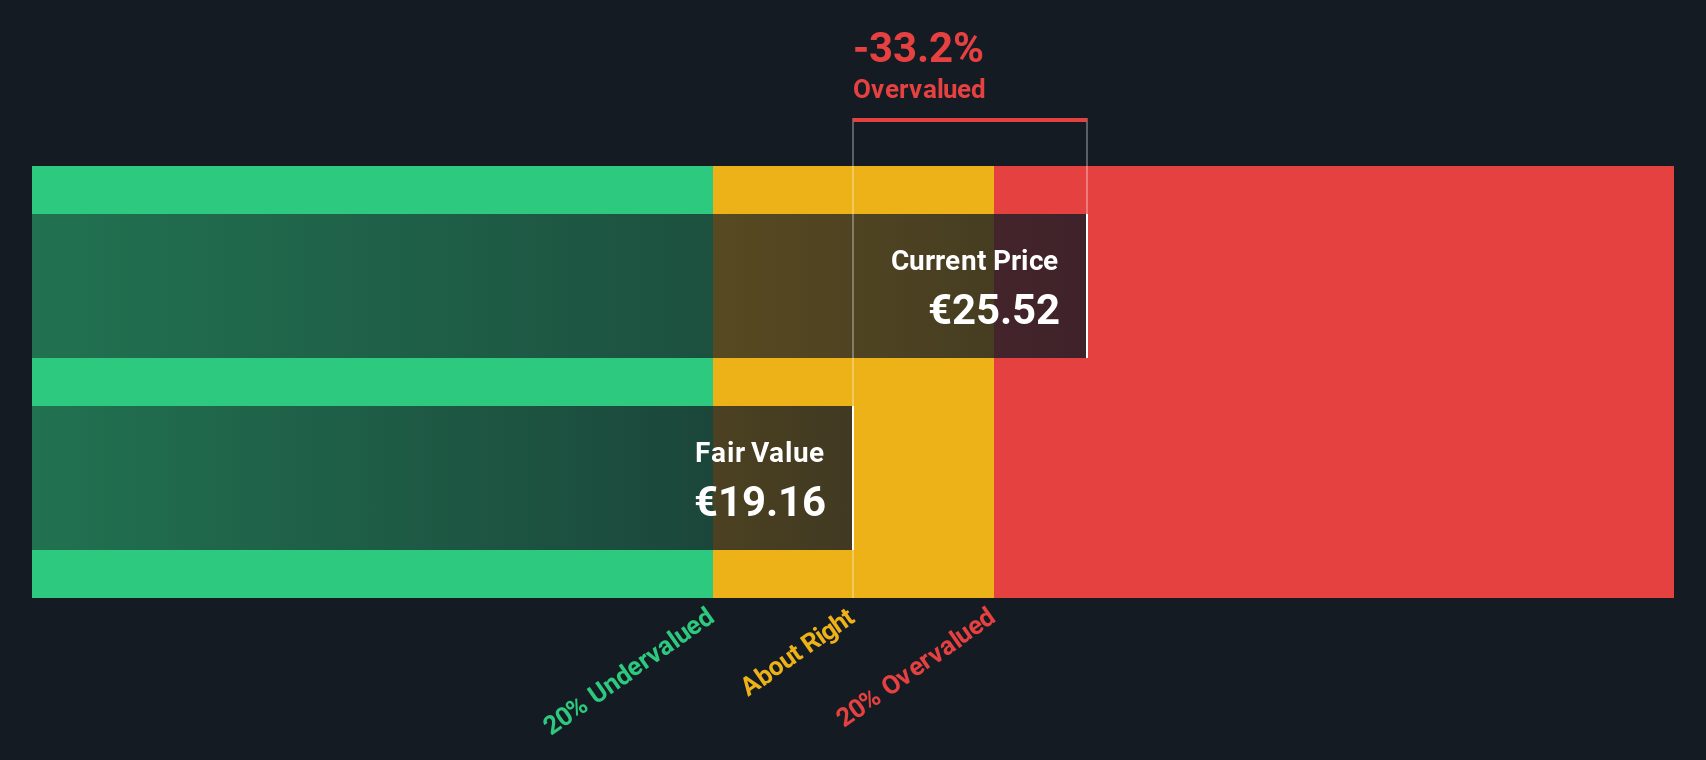
- Using the 2 Stage Free Cash Flow to Equity, Northern Data fair value estimate is €19.16
- Northern Data is estimated to be 33% overvalued based on current share price of €25.52
- The €43.20 analyst price target for NB2 is 125% more than our estimate of fair value
In this article we are going to estimate the intrinsic value of Northern Data AG (FRA:NB2) by taking the forecast future cash flows of the company and discounting them back to today's value. We will use the Discounted Cash Flow (DCF) model on this occasion. Believe it or not, it's not too difficult to follow, as you'll see from our example!
We would caution that there are many ways of valuing a company and, like the DCF, each technique has advantages and disadvantages in certain scenarios. For those who are keen learners of equity analysis, the Simply Wall St analysis model here may be something of interest to you.
The Method
We are going to use a two-stage DCF model, which, as the name states, takes into account two stages of growth. The first stage is generally a higher growth period which levels off heading towards the terminal value, captured in the second 'steady growth' period. To start off with, we need to estimate the next ten years of cash flows. Where possible we use analyst estimates, but when these aren't available we extrapolate the previous free cash flow (FCF) from the last estimate or reported value. We assume companies with shrinking free cash flow will slow their rate of shrinkage, and that companies with growing free cash flow will see their growth rate slow, over this period. We do this to reflect that growth tends to slow more in the early years than it does in later years.
A DCF is all about the idea that a dollar in the future is less valuable than a dollar today, so we discount the value of these future cash flows to their estimated value in today's dollars:
10-year free cash flow (FCF) estimate
| 2025 | 2026 | 2027 | 2028 | 2029 | 2030 | 2031 | 2032 | 2033 | 2034 | |
| Levered FCF (€, Millions) | €112.3m | €173.4m | €123.4m | €97.1m | €82.9m | €74.8m | €69.9m | €67.0m | €65.3m | €64.4m |
| Growth Rate Estimate Source | Analyst x3 | Analyst x3 | Analyst x1 | Est @ -21.34% | Est @ -14.56% | Est @ -9.81% | Est @ -6.49% | Est @ -4.16% | Est @ -2.53% | Est @ -1.39% |
| Present Value (€, Millions) Discounted @ 7.2% | €105 | €151 | €100 | €73.4 | €58.5 | €49.2 | €42.9 | €38.4 | €34.9 | €32.1 |
("Est" = FCF growth rate estimated by Simply Wall St)
Present Value of 10-year Cash Flow (PVCF) = €685m
The second stage is also known as Terminal Value, this is the business's cash flow after the first stage. The Gordon Growth formula is used to calculate Terminal Value at a future annual growth rate equal to the 5-year average of the 10-year government bond yield of 1.3%. We discount the terminal cash flows to today's value at a cost of equity of 7.2%.
Terminal Value (TV)= FCF2034 × (1 + g) ÷ (r – g) = €64m× (1 + 1.3%) ÷ (7.2%– 1.3%) = €1.1b
Present Value of Terminal Value (PVTV)= TV / (1 + r)10= €1.1b÷ ( 1 + 7.2%)10= €545m
The total value is the sum of cash flows for the next ten years plus the discounted terminal value, which results in the Total Equity Value, which in this case is €1.2b. To get the intrinsic value per share, we divide this by the total number of shares outstanding. Compared to the current share price of €25.5, the company appears reasonably expensive at the time of writing. The assumptions in any calculation have a big impact on the valuation, so it is better to view this as a rough estimate, not precise down to the last cent.
The Assumptions
Now the most important inputs to a discounted cash flow are the discount rate, and of course, the actual cash flows. Part of investing is coming up with your own evaluation of a company's future performance, so try the calculation yourself and check your own assumptions. The DCF also does not consider the possible cyclicality of an industry, or a company's future capital requirements, so it does not give a full picture of a company's potential performance. Given that we are looking at Northern Data as potential shareholders, the cost of equity is used as the discount rate, rather than the cost of capital (or weighted average cost of capital, WACC) which accounts for debt. In this calculation we've used 7.2%, which is based on a levered beta of 1.376. Beta is a measure of a stock's volatility, compared to the market as a whole. We get our beta from the industry average beta of globally comparable companies, with an imposed limit between 0.8 and 2.0, which is a reasonable range for a stable business.
Check out our latest analysis for Northern Data
SWOT Analysis for Northern Data
Strength
- Debt is well covered by earnings.
Weakness
- Expensive based on P/S ratio and estimated fair value.
- Shareholders have been diluted in the past year.
Opportunity
- NB2's financial characteristics indicate limited near-term opportunities for shareholders.
Threat
- Debt is not well covered by operating cash flow.
- Has less than 3 years of cash runway based on current free cash flow.
Looking Ahead:
Valuation is only one side of the coin in terms of building your investment thesis, and it ideally won't be the sole piece of analysis you scrutinize for a company. The DCF model is not a perfect stock valuation tool. Preferably you'd apply different cases and assumptions and see how they would impact the company's valuation. For instance, if the terminal value growth rate is adjusted slightly, it can dramatically alter the overall result. Can we work out why the company is trading at a premium to intrinsic value? For Northern Data, we've compiled three fundamental aspects you should assess:
- Risks: For instance, we've identified 3 warning signs for Northern Data (1 is concerning) you should be aware of.
- Future Earnings: How does NB2's growth rate compare to its peers and the wider market? Dig deeper into the analyst consensus number for the upcoming years by interacting with our free analyst growth expectation chart.
- Other High Quality Alternatives: Do you like a good all-rounder? Explore our interactive list of high quality stocks to get an idea of what else is out there you may be missing!
PS. The Simply Wall St app conducts a discounted cash flow valuation for every stock on the DB every day. If you want to find the calculation for other stocks just search here.
Valuation is complex, but we're here to simplify it.
Discover if Northern Data might be undervalued or overvalued with our detailed analysis, featuring fair value estimates, potential risks, dividends, insider trades, and its financial condition.
Access Free AnalysisHave feedback on this article? Concerned about the content? Get in touch with us directly. Alternatively, email editorial-team (at) simplywallst.com.
This article by Simply Wall St is general in nature. We provide commentary based on historical data and analyst forecasts only using an unbiased methodology and our articles are not intended to be financial advice. It does not constitute a recommendation to buy or sell any stock, and does not take account of your objectives, or your financial situation. We aim to bring you long-term focused analysis driven by fundamental data. Note that our analysis may not factor in the latest price-sensitive company announcements or qualitative material. Simply Wall St has no position in any stocks mentioned.
About DB:NB2
Northern Data
Develops and operates high-performance computing (HPC) and artificial intelligence (AI) solutions in Europe and North America.
Slightly overvalued with limited growth.
Similar Companies
Market Insights

Advertisement
Community Narratives
MicroVision will explode future revenue by 380.37% with a vision towards success
Fair Value US$60.00|98.4% undervalued
TH
Community Contributor
The Indispensable Artery for a New North American Economy
Fair Value CA$132.87|1.3% undervalued
TI
Community Contributor