
Advertisement
Here's How P/E Ratios Can Help Us Understand All for One Group AG (ETR:A1OS)

The goal of this article is to teach you how to use price to earnings ratios (P/E ratios). We'll show how you can use All for One Group AG's (ETR:A1OS) P/E ratio to inform your assessment of the investment opportunity. Looking at earnings over the last twelve months, All for One Group has a P/E ratio of 19.3. That corresponds to an earnings yield of approximately 5.2%.
See our latest analysis for All for One Group
How Do I Calculate A Price To Earnings Ratio?
The formula for price to earnings is:
Price to Earnings Ratio = Share Price ÷ Earnings per Share (EPS)
Or for All for One Group:
P/E of 19.3 = €51 ÷ €2.64 (Based on the year to December 2018.)
Is A High Price-to-Earnings Ratio Good?
A higher P/E ratio means that investors are paying a higher price for each €1 of company earnings. That is not a good or a bad thing per se, but a high P/E does imply buyers are optimistic about the future.
How Growth Rates Impact P/E Ratios
Earnings growth rates have a big influence on P/E ratios. If earnings are growing quickly, then the 'E' in the equation will increase faster than it would otherwise. That means even if the current P/E is high, it will reduce over time if the share price stays flat. Then, a lower P/E should attract more buyers, pushing the share price up.
All for One Group maintained roughly steady earnings over the last twelve months. But it has grown its earnings per share by 18% per year over the last five years.
How Does All for One Group's P/E Ratio Compare To Its Peers?
We can get an indication of market expectations by looking at the P/E ratio. If you look at the image below, you can see All for One Group has a lower P/E than the average (24.7) in the it industry classification.
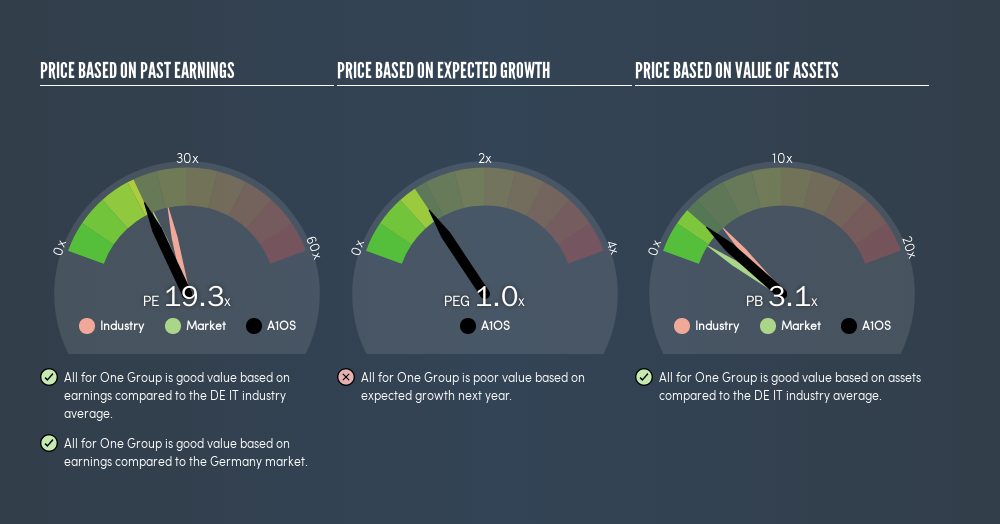
Its relatively low P/E ratio indicates that All for One Group shareholders think it will struggle to do as well as other companies in its industry classification. Since the market seems unimpressed with All for One Group, it's quite possible it could surprise on the upside. It is arguably worth checking if insiders are buying shares, because that might imply they believe the stock is undervalued.
A Limitation: P/E Ratios Ignore Debt and Cash In The Bank
The 'Price' in P/E reflects the market capitalization of the company. That means it doesn't take debt or cash into account. In theory, a company can lower its future P/E ratio by using cash or debt to invest in growth.
Such expenditure might be good or bad, in the long term, but the point here is that the balance sheet is not reflected by this ratio.
Is Debt Impacting All for One Group's P/E?
Since All for One Group holds net cash of €6.5m, it can spend on growth, justifying a higher P/E ratio than otherwise.
The Bottom Line On All for One Group's P/E Ratio
All for One Group's P/E is 19.3 which is about average (20.4) in the DE market. While the lack of recent growth is probably muting optimism, the net cash position means it's not surprising that expectations put the company roughly in line with the market average P/E.
When the market is wrong about a stock, it gives savvy investors an opportunity. If the reality for a company is not as bad as the P/E ratio indicates, then the share price should increase as the market realizes this. So this freereport on the analyst consensus forecasts could help you make a master move on this stock.
Of course, you might find a fantastic investment by looking at a few good candidates. So take a peek at this freelist of companies with modest (or no) debt, trading on a P/E below 20.
We aim to bring you long-term focused research analysis driven by fundamental data. Note that our analysis may not factor in the latest price-sensitive company announcements or qualitative material.
If you spot an error that warrants correction, please contact the editor at editorial-team@simplywallst.com. This article by Simply Wall St is general in nature. It does not constitute a recommendation to buy or sell any stock, and does not take account of your objectives, or your financial situation. Simply Wall St has no position in the stocks mentioned. Thank you for reading.
About XTRA:A1OS
All for One Group
Provides business software solutions for SAP, Microsoft, and IBM in Germany, Switzerland, Austria, Poland, Luxembourg, and internationally.
Undervalued with solid track record and pays a dividend.
Market Insights

Advertisement
Community Narratives
Vita Life Sciences Set for a 12.72% Revenue Growth While Tackling Operational Challenges
Fair Value AU$2.42|8.7% undervalued
RO
Community Contributor
Vossloh rides a €500 billion wave to boost growth and earnings in the next decade
Fair Value €78.41|6.3% undervalued
CH
Community Contributor
Intuitive Surgical Will Transform Healthcare with 12% Revenue Growth
Fair Value US$325.55|56.5% overvalued
UN
Community Contributor